ODS Dashboard
The dashboard is the central, read-only view of one dbt project and its targets.
ods serve hosts it locally: the screens marked Built below are in ods serve
today, the rest are still designs. This design grows it into the control-plane view of
every ODS module; v0.1.0 ships when every screen is built (#309). It stays a server-rendered page with inlined
assets and no npm build (ADR-0009).
Layout.
- Left nav: project and target pickers, then Home, Catalog (Models, Freshness evidence, Semantic layer), Lineage, State (Plan, Runs, History, Policies), ERD, Usage, CI · Impact, Agent and Settings. A "Local · read-only" badge sits at the bottom.
- Page header: a breadcrumb, a search box that also accepts selectors
(
+orders), and the current snapshot. - Look: IBM Plex Sans and Mono, with an indigo accent (
#3F51D8). Build is blue (#DCE8FB/#1F4FA0) and Reuse is teal (#D5F0EC/#0B6B60). Health is green, amber, red, and dashed grey for unknown.
Light is the default. Home, Lineage, Model and Plan also have dark versions.
What is built (each screen below says so, and what it still lacks):
| Screen | Status |
|---|---|
| Shell and Home | Built (#310) |
| Catalog: models, and the Model page | Built (#313, merged in #319) |
| Lineage: State overlay | Built (#312, merged in #320) |
| State: Plan and Why, Runs, one Run | Built (#311, merged in #318); real run outcomes, durations and per-node stats from run journals (#322 steps 1 and 3) |
| Live run on the DAG, with follow mode | Built (#322): the event stream, the Live overlay on Lineage, follow mode and scopes, node stats, the Home banner |
| Lineage: Impact simulator | Built (#347): rename, type change and drop, with what breaks; no contract warning or exposures yet |
| ERD | Built (#64): the diagram with edge evidence, cardinality, scope, missing relationships with their tests, and SVG export |
| Catalog: freshness evidence | Built (#350): sources and seeds, their evidence and grade, what readers were built from, their decisions, and what is downstream |
| Semantic layer, Settings | Designed (#309) |
| Dark mode | Built where the page's CSS follows prefers-color-scheme; not yet checked against every dark board (#309) |
The recordings on this page are real: ods serve on the demo project, played by
scripts/record-dashboard.py (how they're made). The images
under each heading are the design boards.
Screens

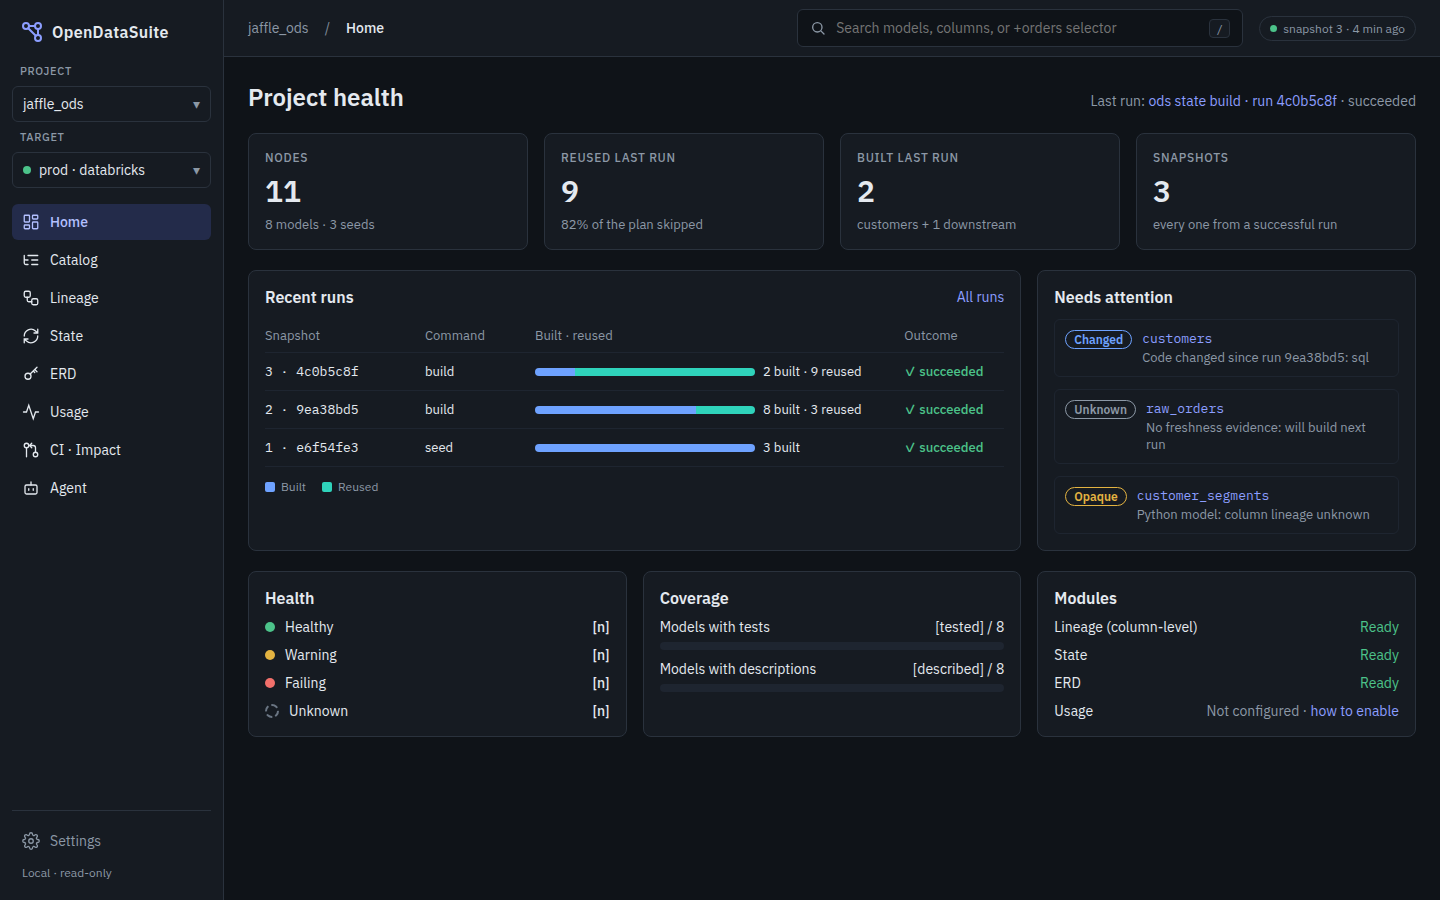
Home: project health
Built (#310). Health and coverage come from real signals (#354), and say not measured where ODS can't tell. A run's outcome in Home's run list reads recorded (the Runs page has the journal's outcome).
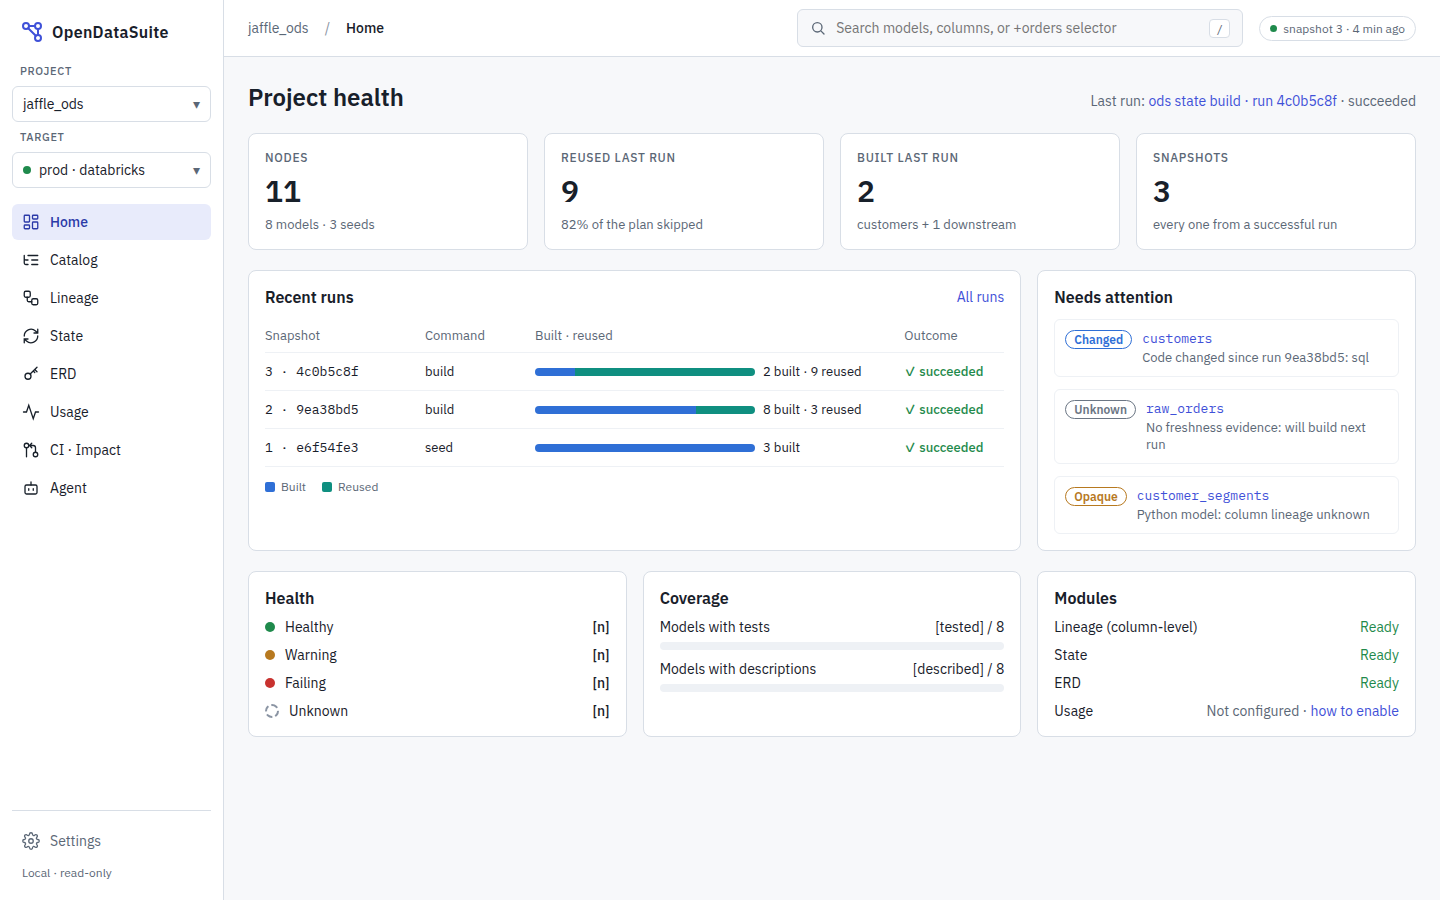
- Tiles: nodes, reused and built in the last run, and snapshots.
- Recent runs: built and reused counts per run.
- Needs attention: changed, unknown-evidence and opaque nodes.
- Summary panels: health, test and doc coverage, and which modules are set up.
Needs: State history (ods state history), the plan, the last run's record and the
manifest (for coverage).
Catalog: models
Built (#313). Each node's health badge (#354) comes from the last run's record, its
last build and its tests; the health facet filters by it. Scores and trends are #117.

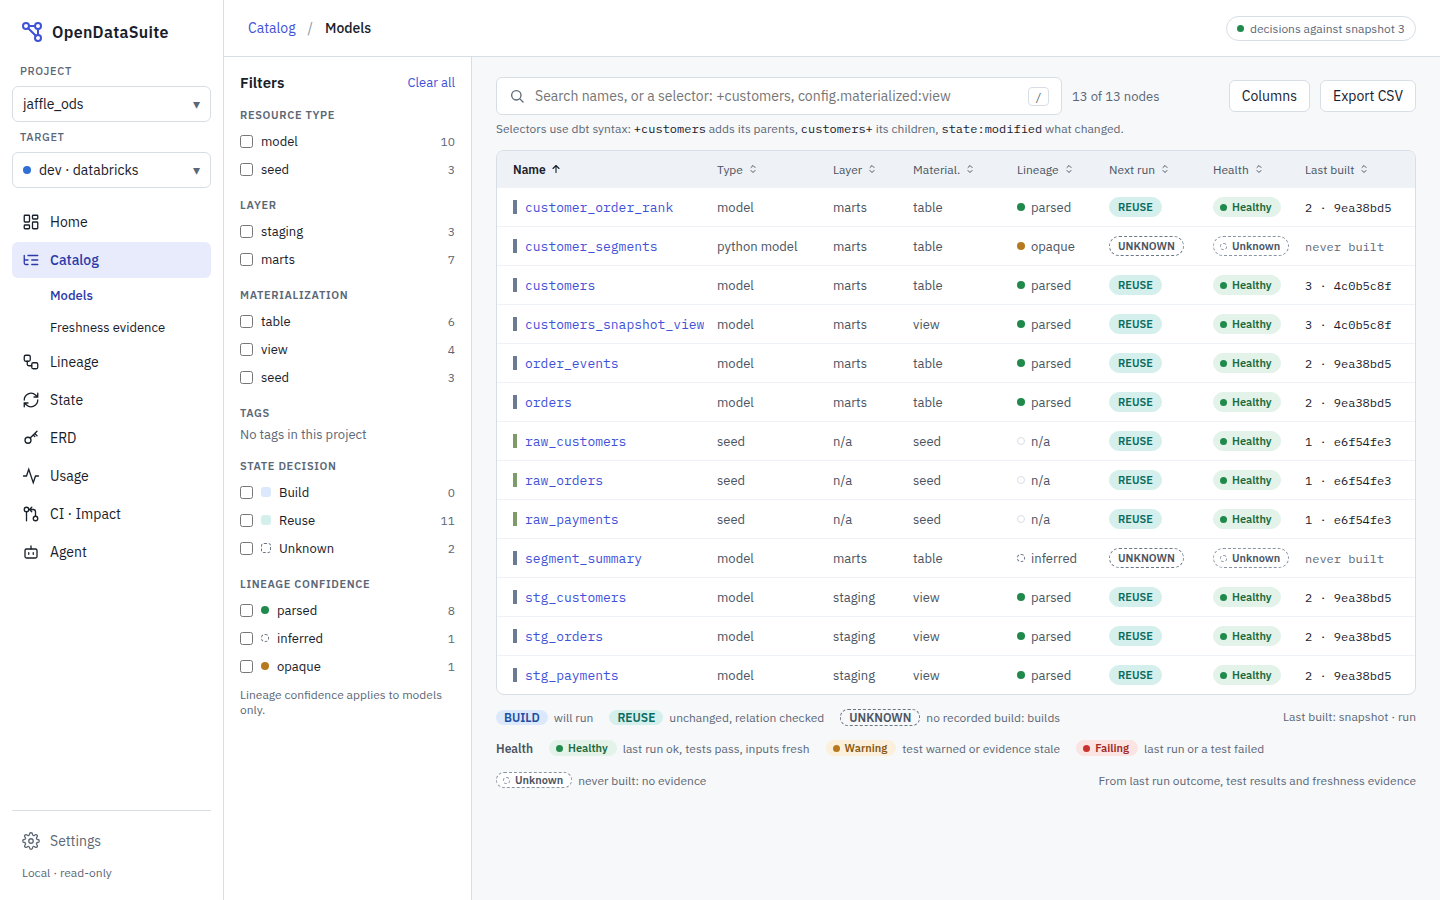
- Facets: resource type, layer, materialization, tags, next-run decision and lineage confidence.
- Table: every node, with its next-run pill, health badge and last build.
Needs: - the manifest; - the plan against the latest snapshot; - a health badge per node, worked out from the last run outcome, test results and freshness evidence (static; no monitoring service).
Catalog: freshness evidence
Built (#350) at /catalog/sources. The grades are the planner's own (exact,
semantic, proxy, inferred, unknown), where the board groups the middle ones as
timestamp; a source's numbers are the ones ods state explain gives for a model
reading it.
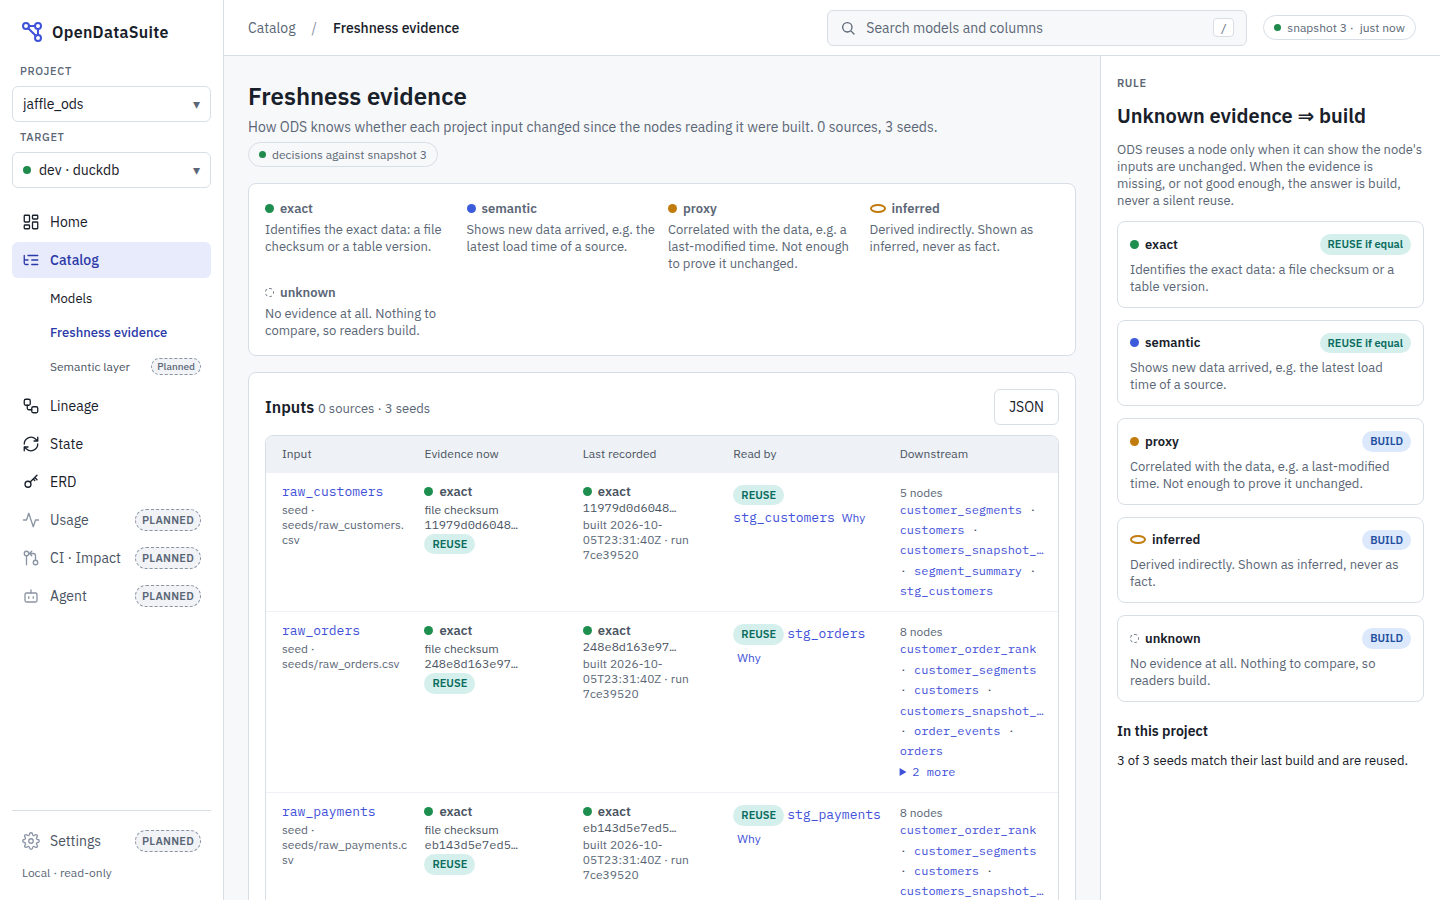
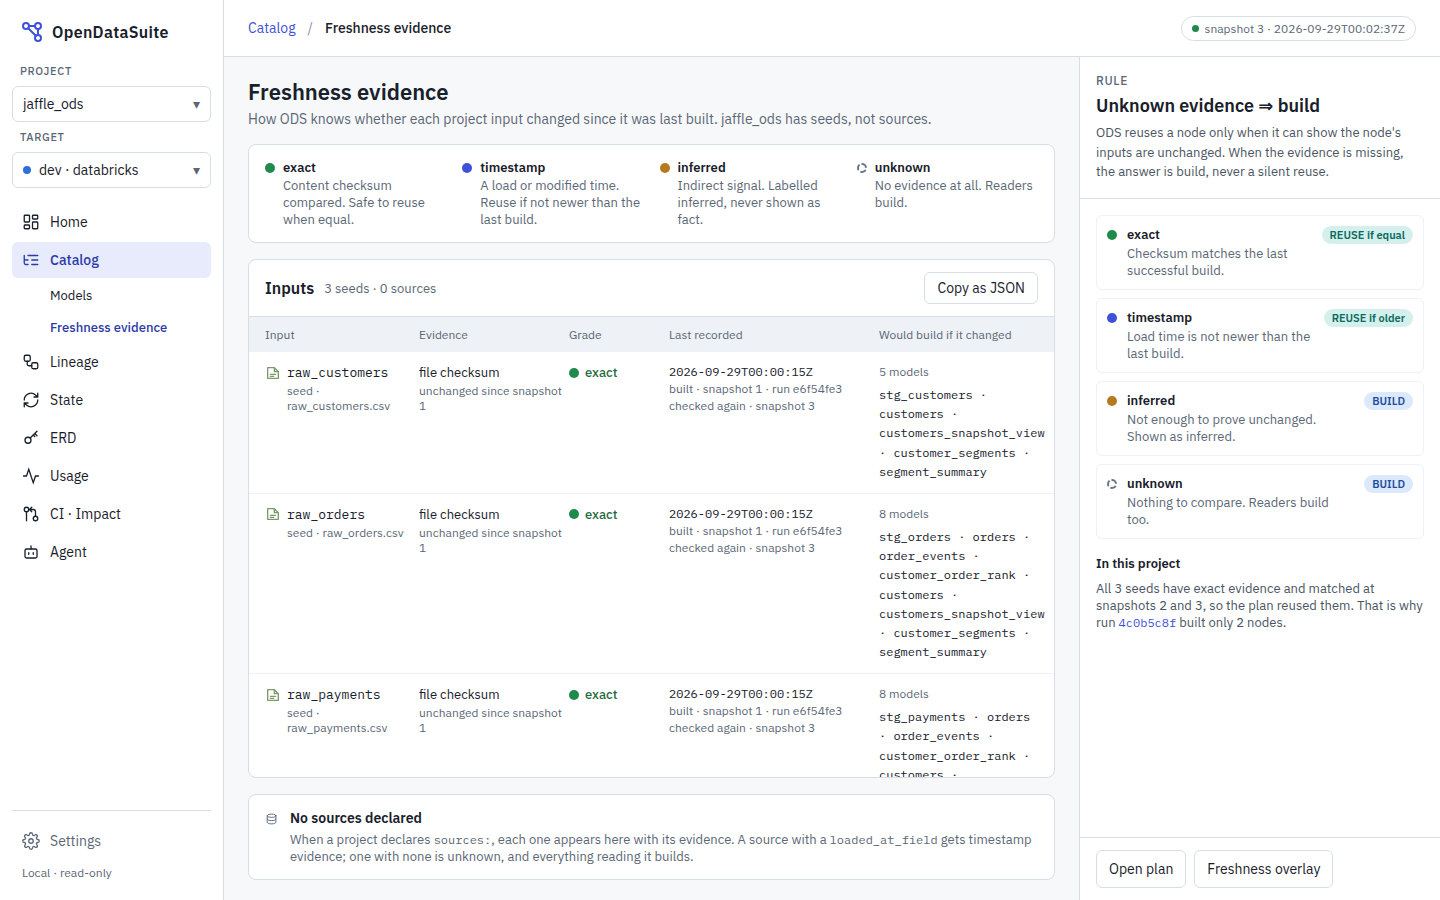
- Evidence per input: how ODS knows whether each seed or source changed.
- Grades: exact, timestamp, inferred and unknown, and what each grade does to the plan. Unknown evidence always means build.
Needs: the freshness evidence already recorded in each snapshot.
Catalog: semantic layer (placeholder)
Not built yet (#309).
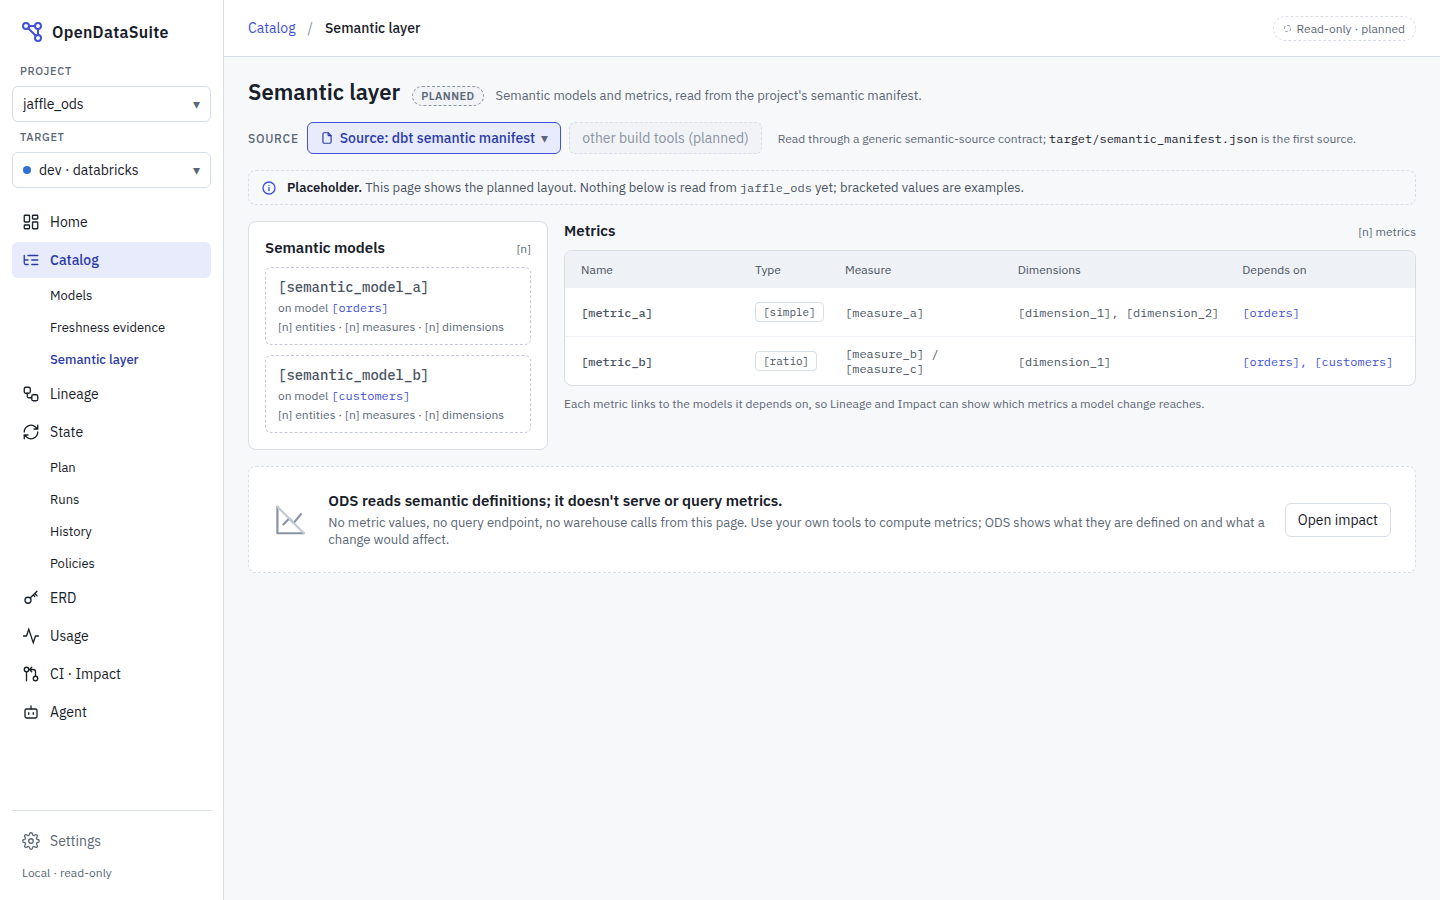
- Contents: semantic models and metrics, read from the project.
- Source picker: "dbt semantic manifest" is the first source; other build tools are greyed as planned.
The read goes through a generic semantic-source contract, so another build tool can plug in the way warehouses do. ODS reads definitions only; it never serves or queries metrics.
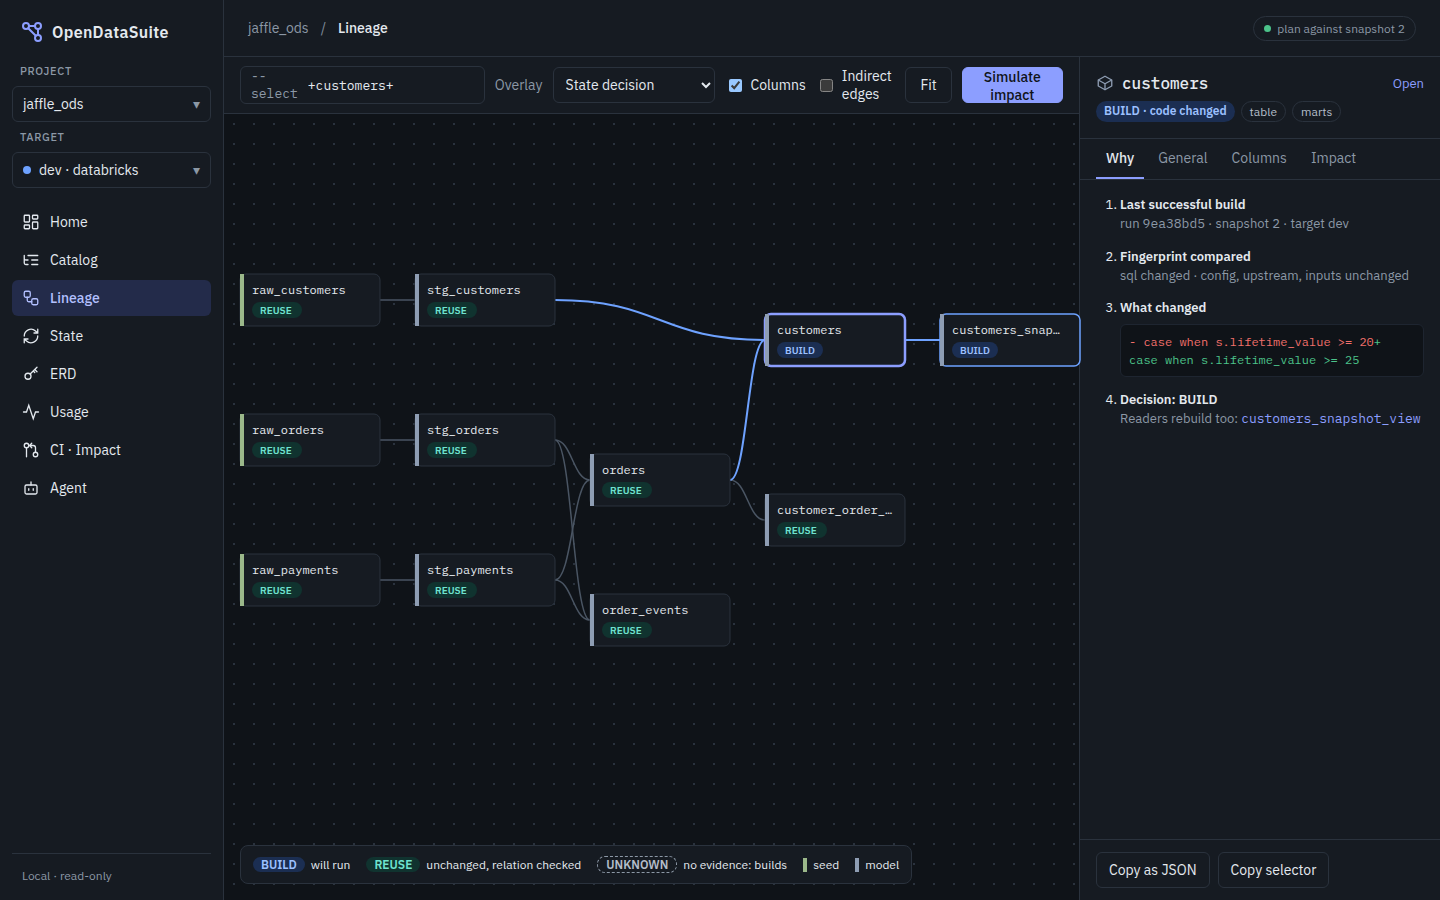
Lineage: State overlay
Built (#312).

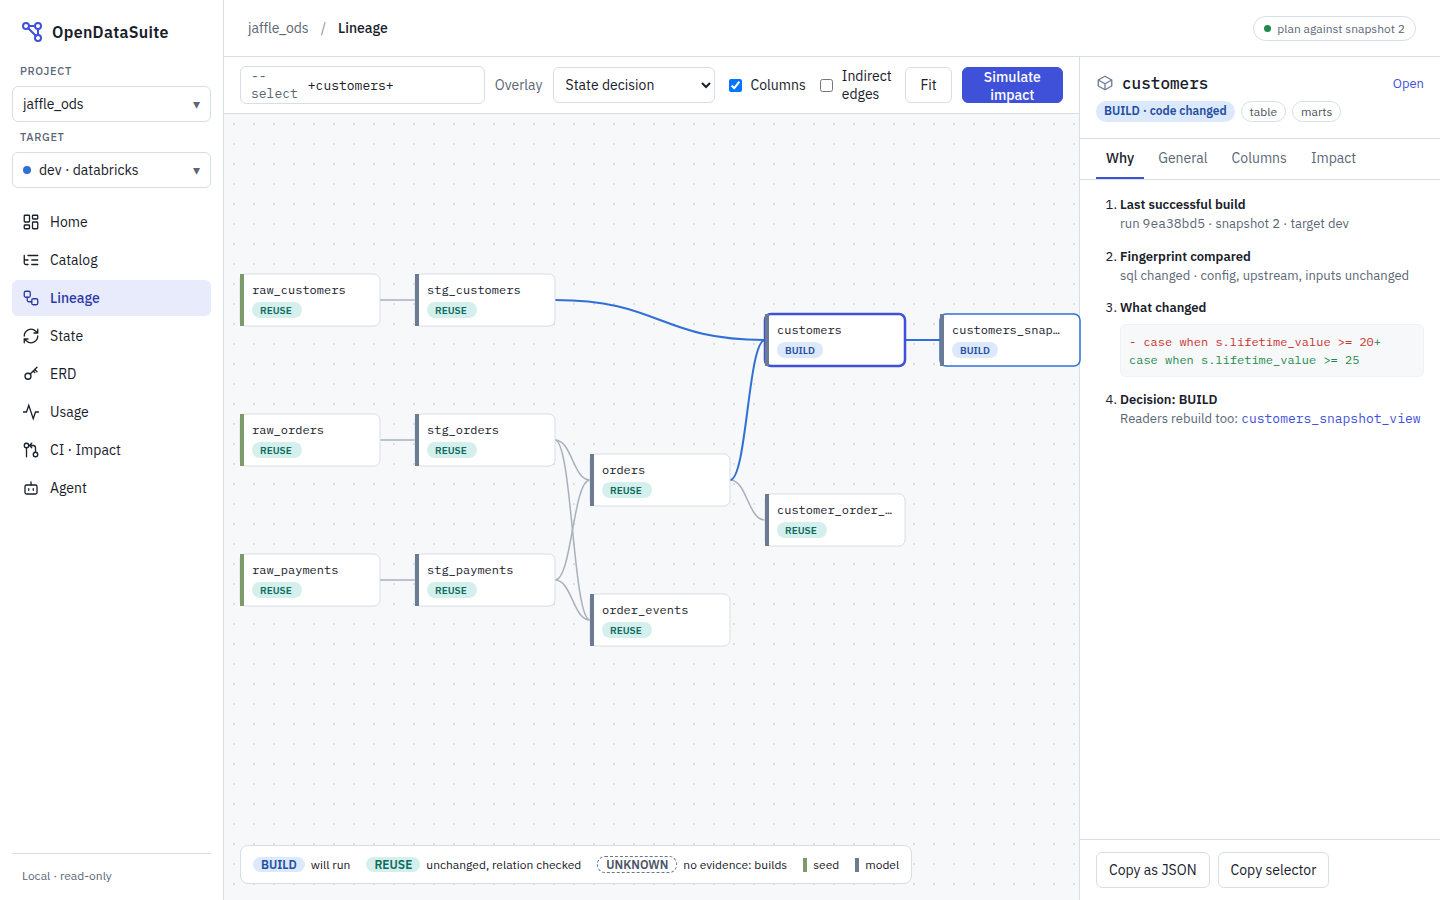
- Graph: the model graph, coloured by the plan's decision for each node.
- Side panel: the reason for the selected node.
Needs: ods lineage and the plan. Model-to-model edges come from the DAG. They
are not relationships; those belong to the ERD (AGENTS rule 6).
Built (#312) with these tokens (light / dark), beside the board's:
| Token | Light | Dark | Used for |
|---|---|---|---|
--kind-seed |
#7C9A6A |
#9BB88A |
seed stripe (the board's) |
--kind-model |
#6B7B93 |
#8E9DB3 |
model stripe (the board's) |
--kind-source |
#A08450 |
#C9AE7C |
source stripe (not on the board) |
--kind-snapshot |
#8570B0 |
#B0A0DA |
snapshot stripe (not on the board) |
--edge |
#A7B0BD |
#4A5563 |
DAG edge; dashed when only declared |
--edge-indirect |
#A98BD0 |
#B59BE0 |
row-shaping column edge, dashed |
--edge-up |
#4A5462 |
#C9D1DB |
↑ upstream of a traced column |
--edge-down |
#D9730D |
#FFA34D |
↓ downstream of a traced column |
--maybe |
#8A5A00 |
#E3B341 |
past an opaque node: may change (dashed) |
--warn-text |
#8A5A00 |
#E3B341 |
warning text (AA on the panel) |
The model graph's selection path uses the accent. NEVER BUILT is an outlined build
pill; UNKNOWN keeps the board's dashed pill. The offline page (ods lineage view) has
no font files, so it falls back to the system fonts.
Lineage: impact simulator
Built (#347) at /lineage/impact, opened from the Lineage section, a column's
Simulate link on its Model page, or the explorer's Impact tab.
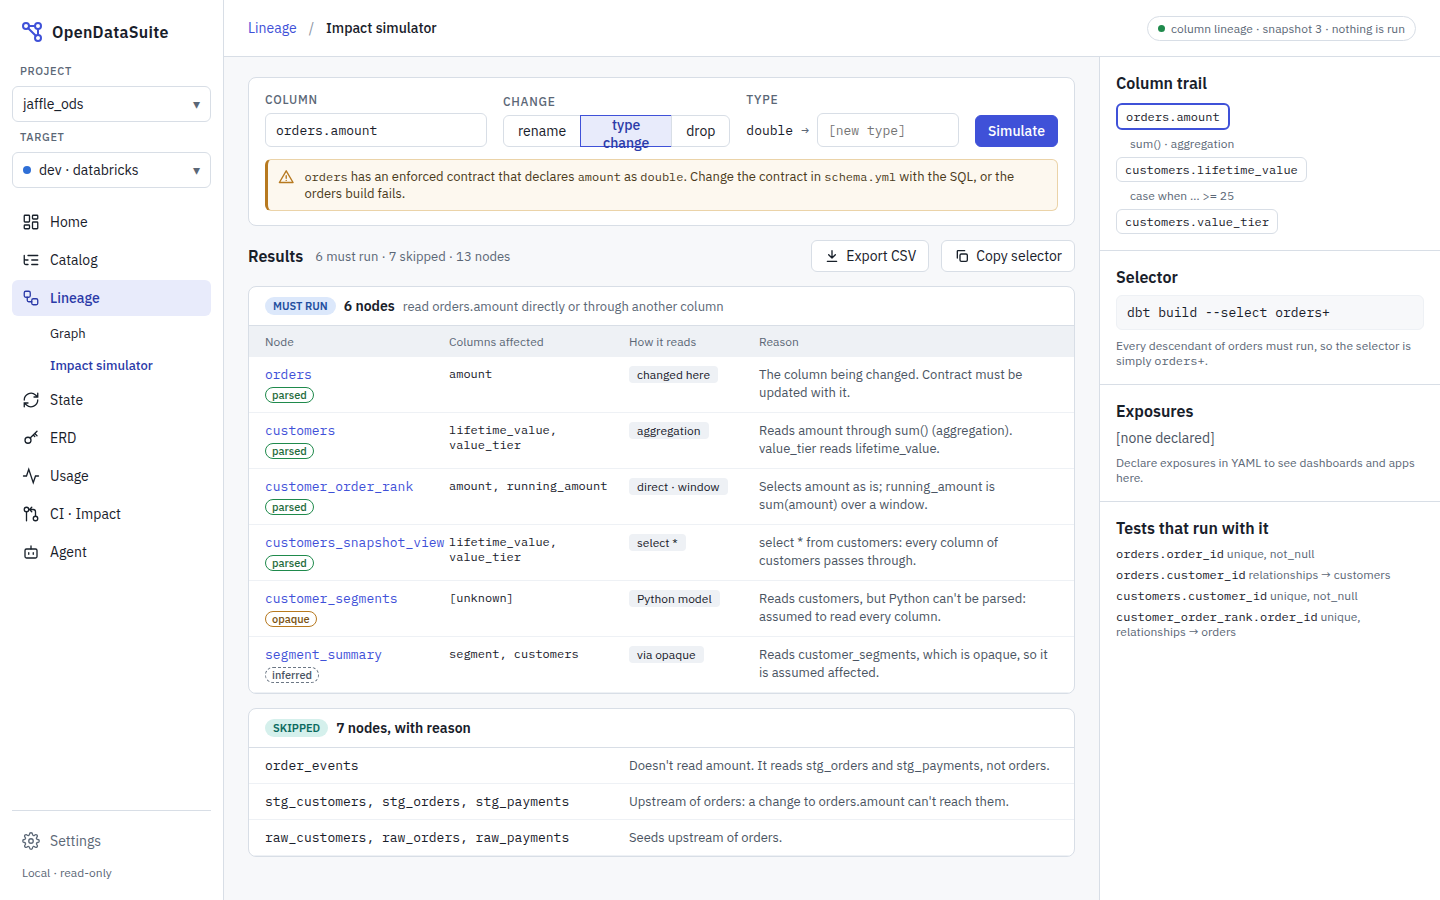
- Input: pick a column and a change (rename, type change or drop).
- Must run: each node, with its reason and whether its lineage is parsed, inferred or opaque.
- Skipped: each node left out, with the reason.
- Side panel: the column trail, a copyable selector, and the tests that run with
it. As built, the selector is an
ods state build -s …command. - Contracts: a warning when an enforced contract would break. Not built: ODS doesn't read model contracts yet; nor exposures, which the design's side panel lists.
As built, each node that must run also says what the change does to it: breaks (its
SQL names a column that goes away), loses column (passed through select *),
unknown (opaque lineage, never "not affected") or affected. The board's Export
CSV is a JSON link to /api/lineage/impact instead.
Needs: column-level impact (ods lineage impact). Nothing is run.
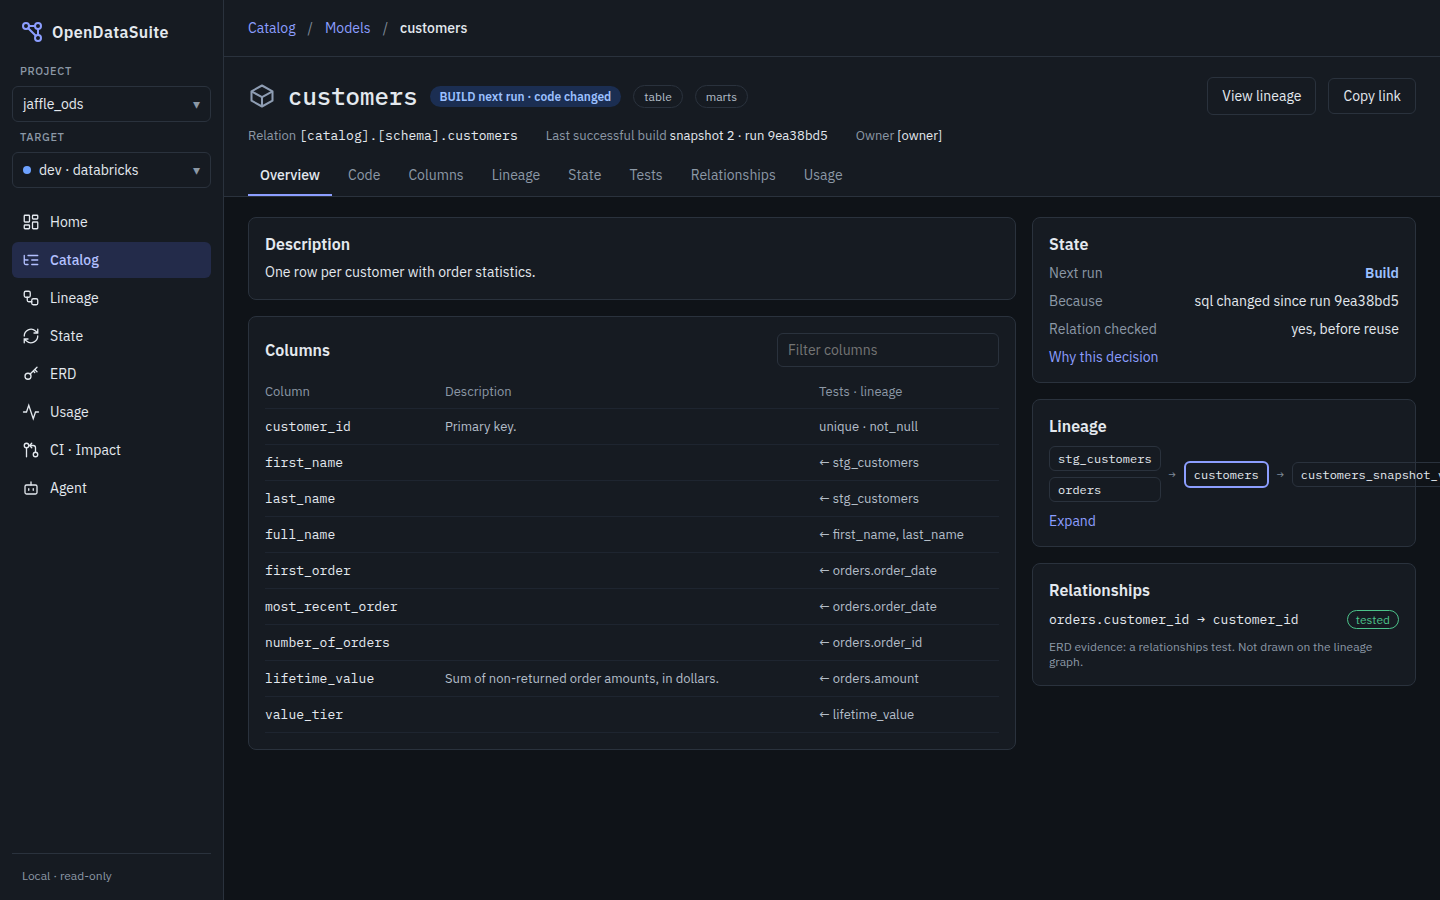
Model page
Built (#313): Overview, Code, Columns, Lineage, State and Tests; Relationships and Usage are greyed as planned.
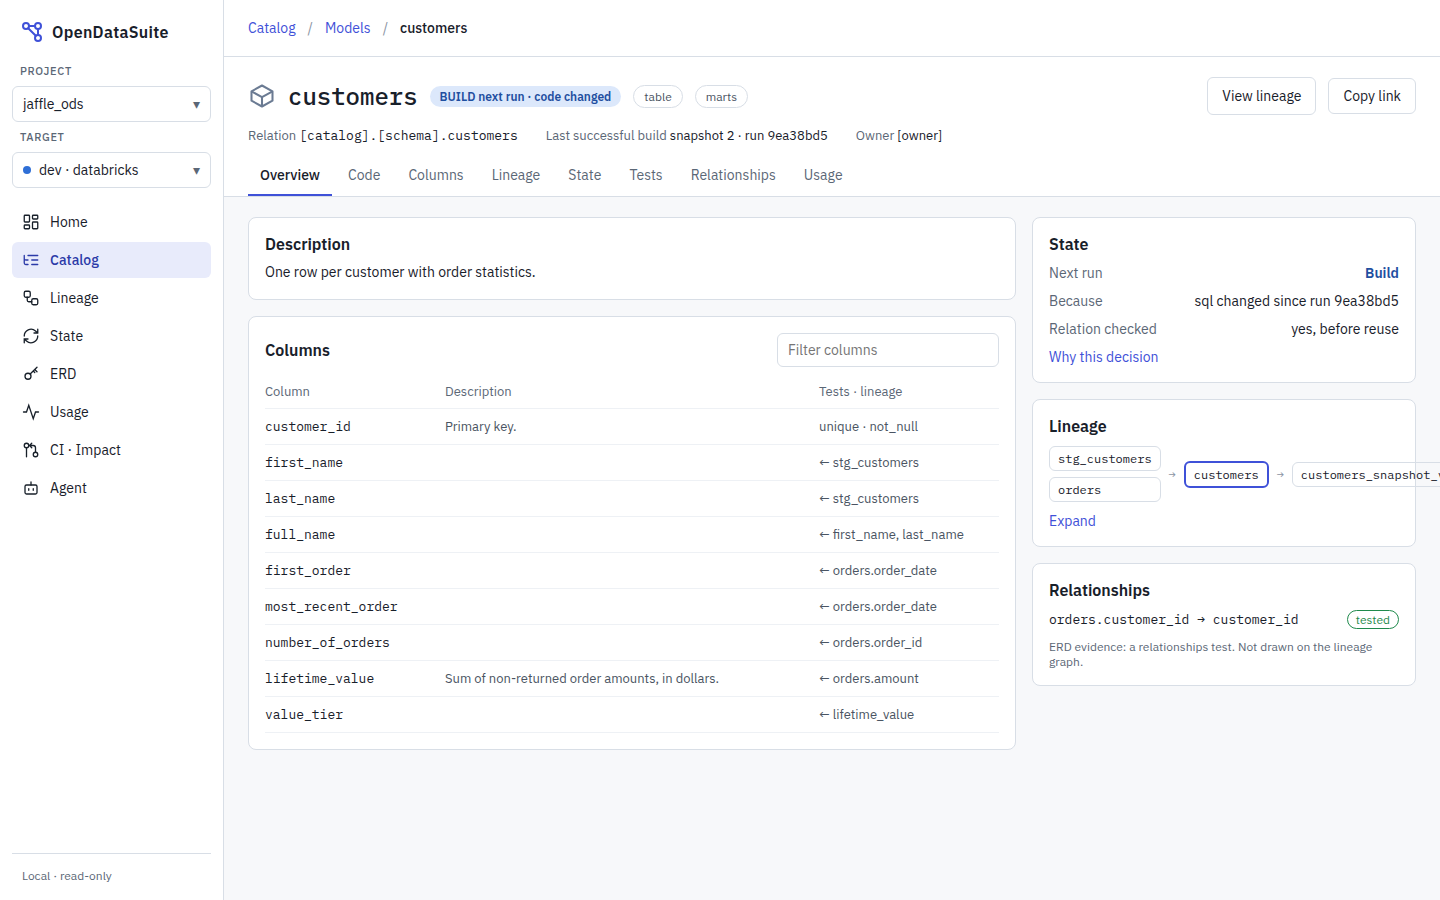
- Tabs: overview, columns, lineage, code, State and tests.
- Current decision: the Build or Reuse pill, with its reason.
- Open in warehouse (#329): a header button to the relation in the warehouse's
own UI, labelled by the provider (Open in Catalog Explorer ↗ on Databricks), in a
new tab with
rel="noopener noreferrer". Beside the relation, expected location says it is where the manifest puts it, not a check that it exists. Without a link, the header says why in italics (no provider for the warehouse, no host, a relation that isn't fully qualified); a URL is never guessed. The lineage side panel (head and General tab) and each row of a run's Nodes table (a small ↗ after the name, the reason once under the table) carry the same link. The dashboard gets it as neutral fields from the CLI, never from a provider.
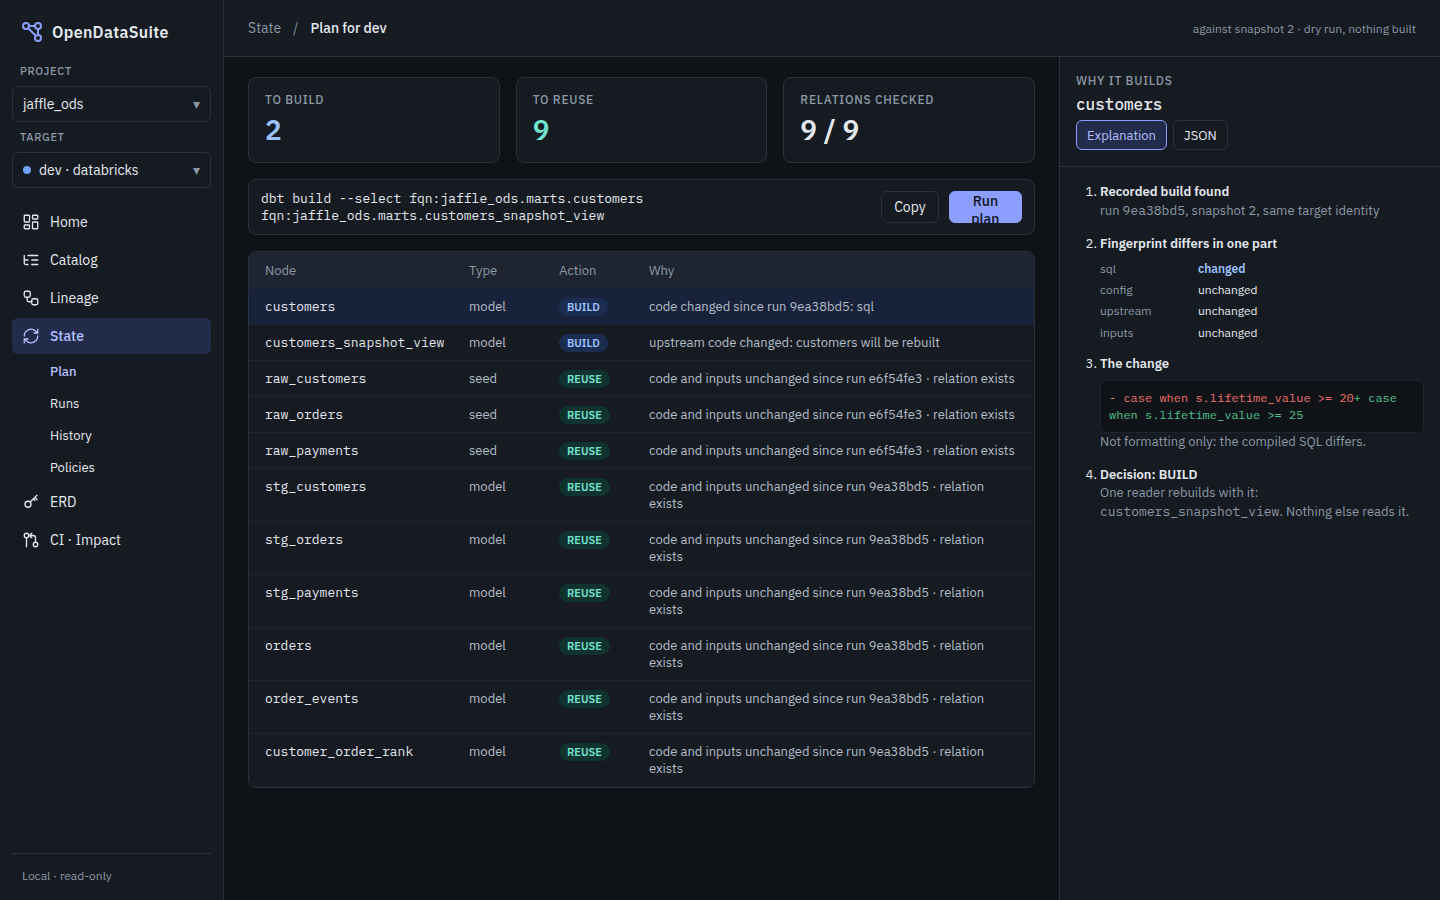
State: plan and why
Built (#311).

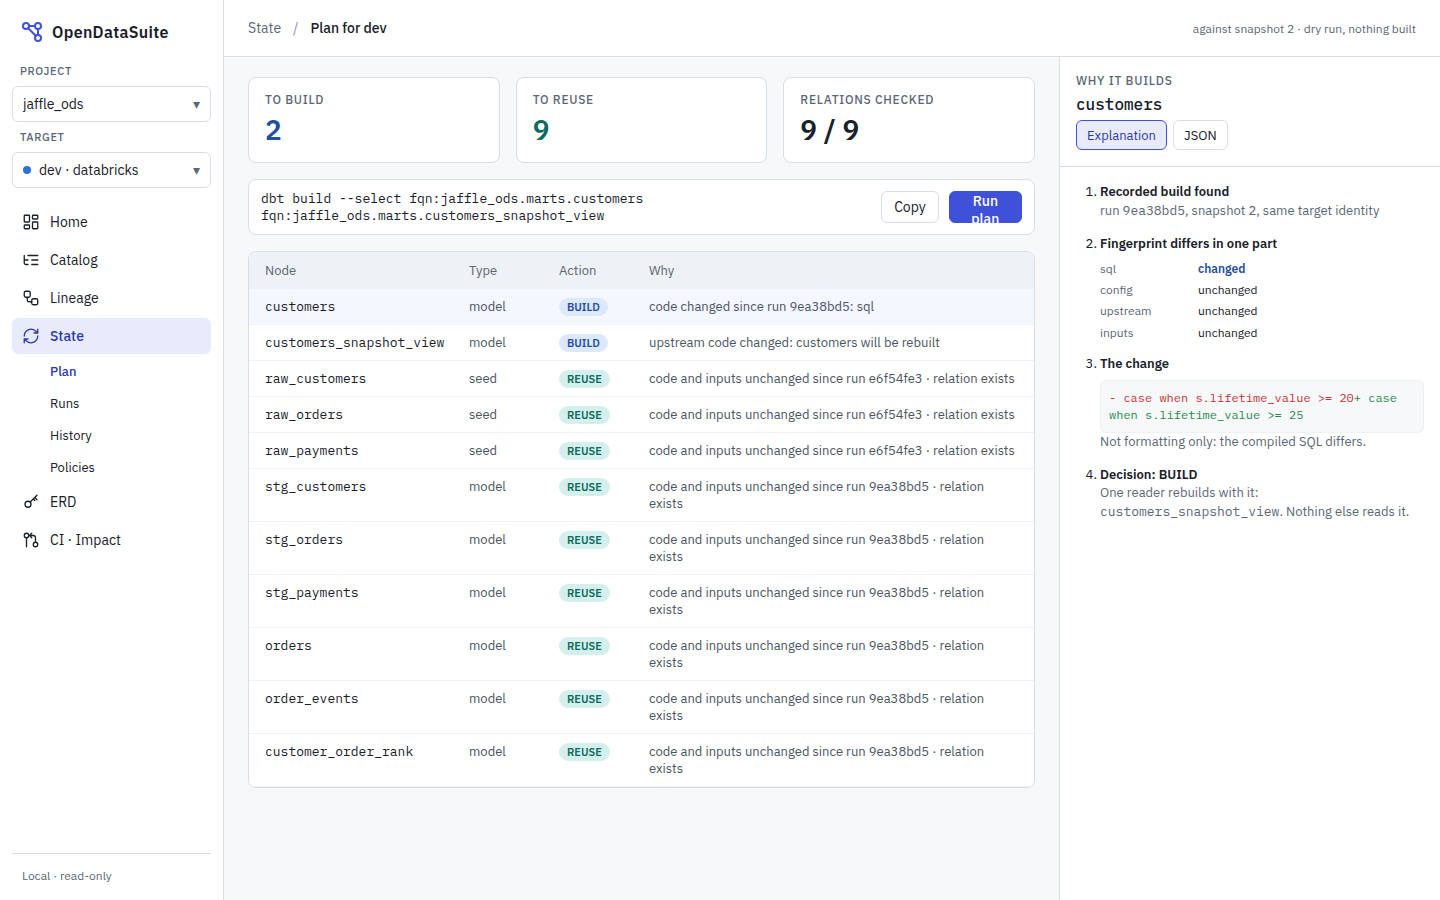
- Decision table: every node, with its decision and reason code.
- Why panel: for the selected node, the reason chain, the fingerprint components that changed, and the relation check.
Needs: ods state plan --output json, which already carries all of this.
State: runs (local)
Built (#311), with outcomes, rows and durations from run journals (#322 step 3).
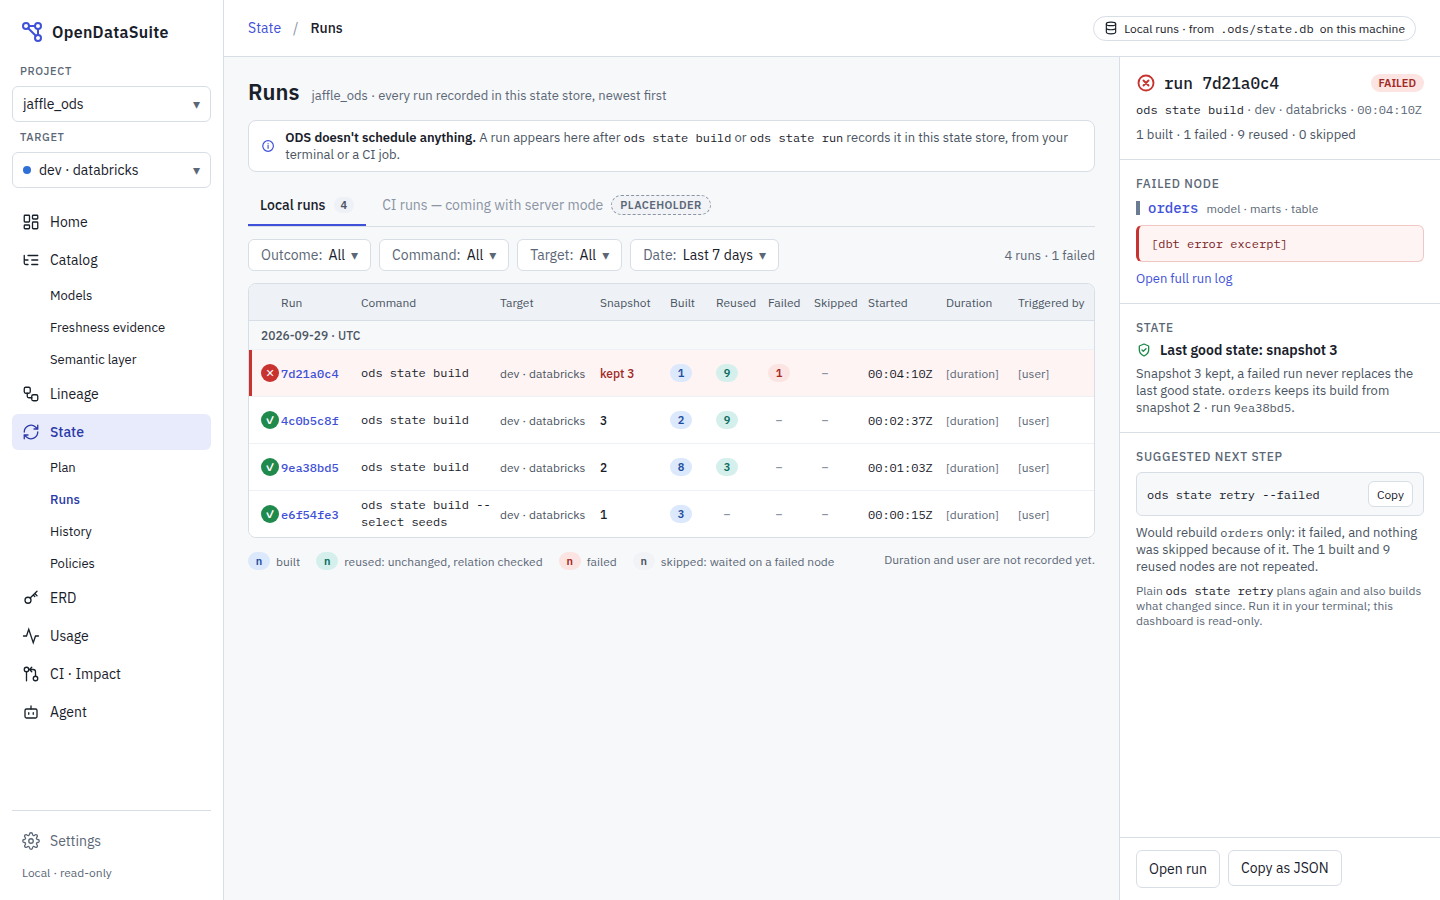
- Source: every run recorded in
.ods/state.dbon this machine, and every run whose journal is kept beside it (#322), newest first. ODS doesn't schedule anything; runs appear afterods state build/runin a terminal or CI job. - Each run: its outcome (succeeded, partial, failed; unknown or "running or stopped without finishing" when its journal doesn't say, never success), node counts, rows ("at least N" when some nodes didn't report) and duration, from its journal. A run without one says so, and its outcome reads recorded.
- Failed run: shows that the last good snapshot was kept, the failed node with its
redacted error summary, and the next command (
ods state retry --failed). A failed run that recorded nothing is listed from its journal. - Partial run: some nodes failed and others succeeded. As before #322, its
snapshot records the successful builds only
(ADR-0013:
record()advances only nodes whose status is success); failed and skipped nodes keep their last good build (AGENTS rule 5). It is amber, not red or green. - CI runs: a placeholder tab until server mode.
State: one run
Built (#311), with the timeline and per-node stats from its journal (#322 step 3). A run still going isn't followed live yet (#322 step 4).
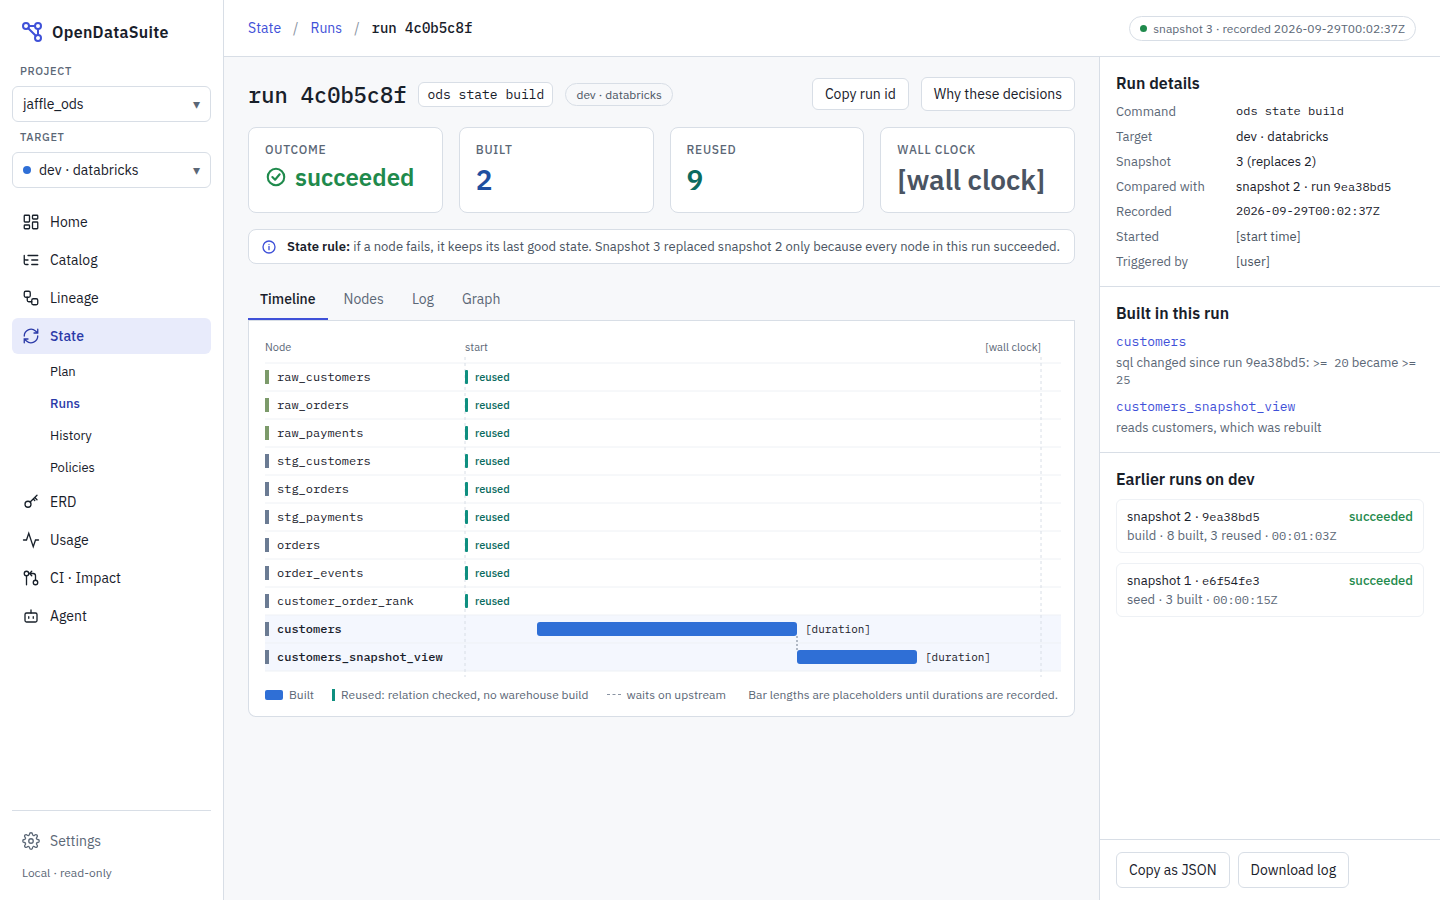
- Timeline: when each node started and finished, from the run's journal, as bars
(red when it failed), beside the nodes that kept an earlier build. Without a journal,
the order comes from lineage and times read
—. - Totals and Nodes: node counts by status and rows under the tiles; the Nodes tab
lists each node's status, start, time taken (compile and execute), rows (
—with the reason), thread, tests, why it ran and a failed node's error. - Built this run: why each node was built.
- Earlier runs: the runs before it.
Needs: the snapshots (ods state history) and the run journals
(<state-db>.runs/, ADR-0024).
ERD
Built (#64) at /erd, from the same ERD as ods erd generate --infer.
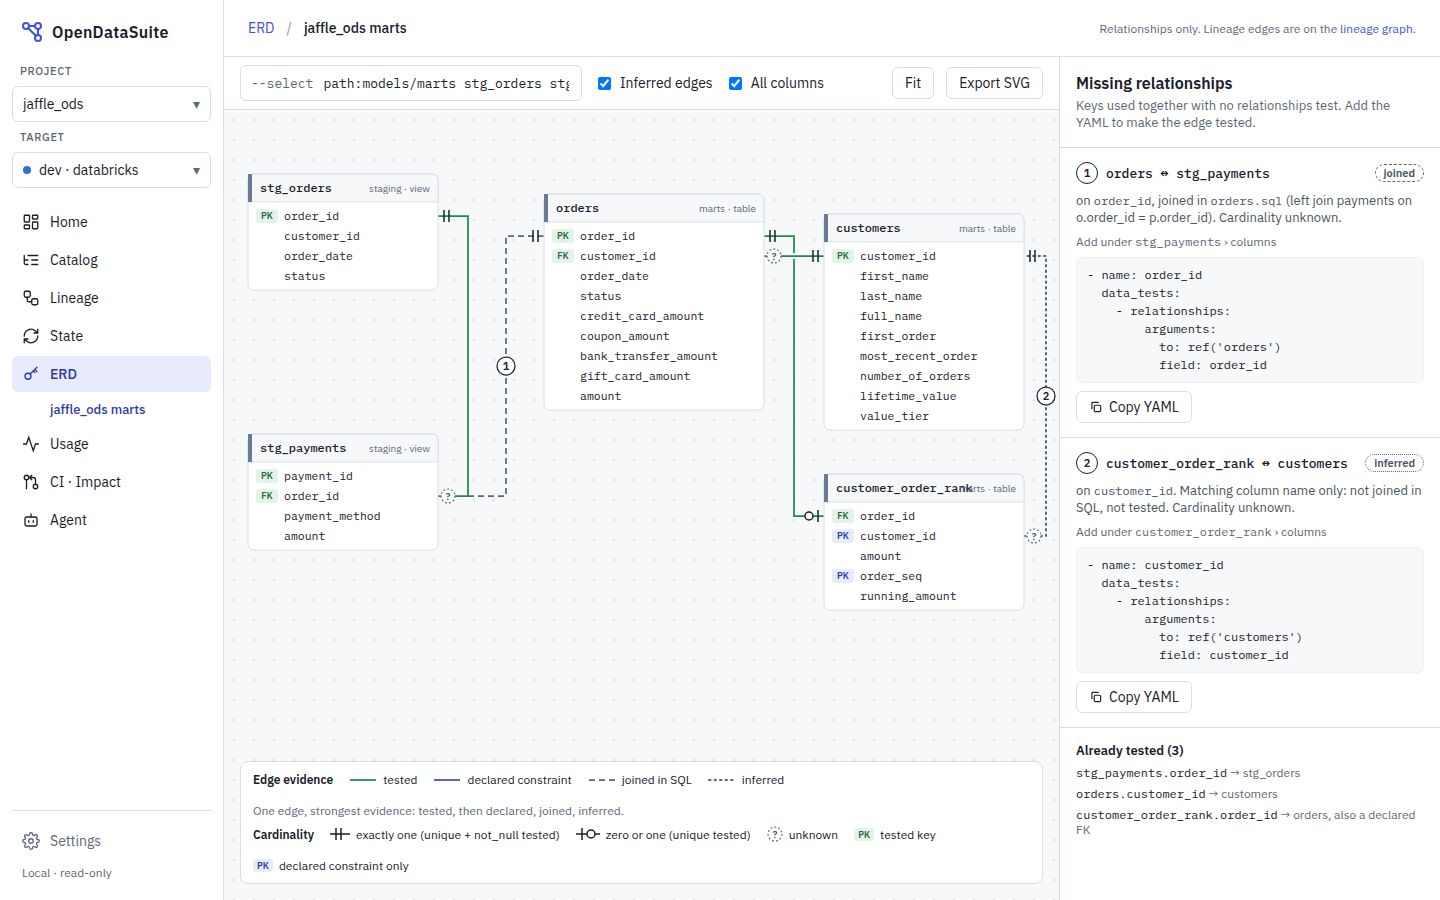
- Diagram: tables and keys, with each edge drawn by its strongest evidence: tested, declared constraint, joined in SQL, or inferred.
- Cardinality: only where tests prove it.
- Missing relationships: each comes with the YAML test that would make it tested.
As built, the board's saved views (jaffle_ods marts in the navigation) aren't there
yet: the scope is the --select box and a depth, kept in the URL. Clicking an entity
or an edge shows its keys or evidence in the side panel, and Every relationship lists
them as a table.
Needs: ods erd generate.
Settings
Not built yet (#309).
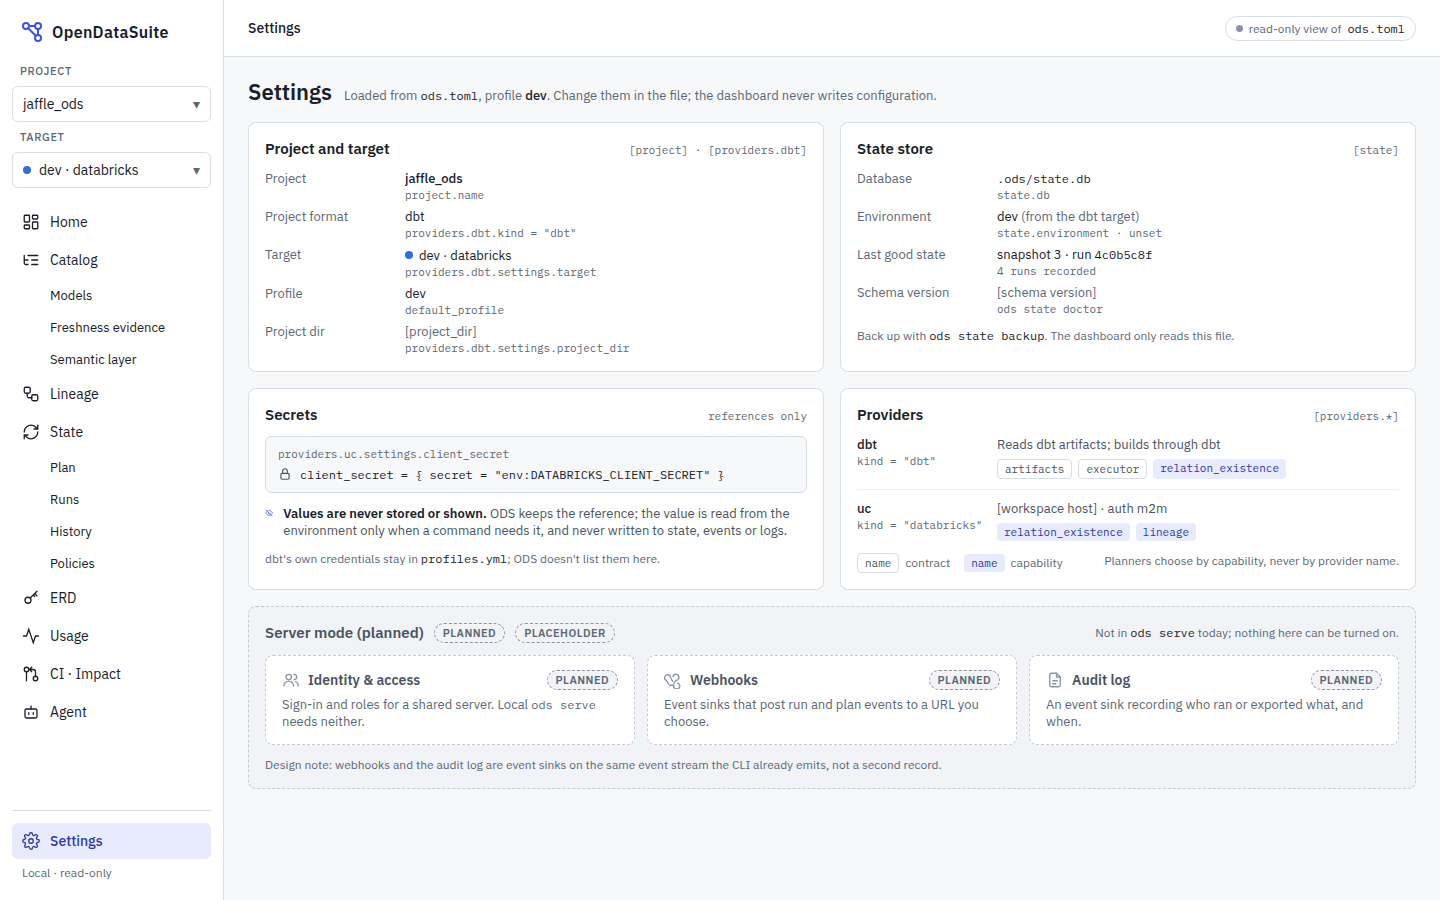
- Read-only view of
ods.toml: project and target, the state store, secret references (never values), and providers with their capabilities. - Server mode (planned): Identity & access, Webhooks and Audit log, greyed as placeholders. Webhooks and audit are designed as event sinks on the event stream the CLI already emits, not a second record.
Live run on the DAG, with follow mode (#322)
Built (#322). ods serve streams the run's journal as it is written
(ADR-0024, "The live
stream"), and the Lineage page shows it as the Live run overlay
(/lineage?live=<run_id>, &follow=<node>:down|up|self).

Built as designed, with these differences from the boards:
- The graph is the Lineage page's (dagre's layout, kind stripe on each node), so nodes
sit where the State overlay has them, not on the board's grid. Nodes are the board's
196 × 72 while the run is shown.
- The toolbar drops search, the column view and impact while a run is shown, as the
board's has none. There is no room beside the focus line at 1440 px for the board's
explanation, so it is the line's tooltip, and in focus mode a short note above the
edge chips says where follow goes next.
- The minimap is shown on every live run, not only on large DAGs, and hidden once the
run ends (the Complete board has none). Follow frames above its corner, so it never
covers what it frames; the "run finished" toast sits above it while it shows.
- At the end of a run, the view shows the whole graph if it reads at 60%, else every
node that ran, else the failed and skipped nodes (unless follow was off). Jump to
failure goes once the failure is selected and in view, and a scope chip becomes a
plain Scope: … chip: nothing is followed any more.
- Python models draw their state only (the Lineage page's dashed "opaque" border would
read as queued or skipped); their kind shows in the node's corner tag (py) and on
the card (python model, with the materialization).
- Home's banner says Run probably in progress, with an inferred chip and a hollow
dot: a journal still being written is the only sign a run is going on.
- A node the run doesn't touch reads KEPT only when a build of it is recorded;
otherwise NOT RUN, never a build it doesn't have. Sources read SOURCE.
- The stats card is the Run page's (its view model and its explanation card, #323,
and the relation link, #329), served as a fragment, so it says the same as the Nodes
tab: the thread as the engine names it (Thread-1 (worker)), — with the reason for
every stat not reported (a failed or skipped node's rows and tests say the node
didn't build). "Why it ran" is the snapshot's reason once the run recorded one;
while it runs, Planned because gives the plan's reason when the page opened.
- The Run page of an unfinished run links to the live view; its timeline doesn't
update live.
The boards are in docs/design/dashboard/boards/live-run/ in the repository; like every board they are left out of the docs site and open in the Design canvas (see the design README). Main.dc.html there is interactive: it plays a demo run, and the other boards reuse it in fixed states. Screenshots will be added once they are exported from the design canvas.
- What the page shows:
- A Live overlay on Lineage while
ods state runorbuildis running. - Each node shows one state: queued, running, built, failed, skipped (upstream failed) or kept (not selected in this run).
- Nodes show their elapsed time while running, and their time taken and rows once finished.
- The side panel shows progress, counts, what is running now, rows affected so far and an event log.
- Follow mode:
- It is on by default. The camera frames every running node at once, moves at most about once a second, and never zooms below about 60%.
- If the running nodes can't all fit at that size, the camera keeps one focus node until it finishes. It then moves to the running node blocking the most queued work (the nearest one on a tie).
- Running nodes outside the view show as edge chips. A minimap shows the whole run.
- Any pan, zoom, Fit or node click turns follow off. Follow run turns it back on, and so does
Fin the real page. - Follow scopes:
- The node menu (right-click, the menu key or Shift+F10) and the stats card offer "Follow this node and its downstream", plus upstream or just this node.
- Nodes outside the scope fade. A toolbar chip clears the scope.
- The scope is kept in the URL.
- Node stats:
- Status, start and end time, time taken (compile and execute), rows affected, adapter extras, thread, relation, why it ran, and tests.
- A stat that isn't reported shows as
—with the reason, never as0. Run totals say "at least N". - Terminal: the same per-node lines and summary in
ods state run.
Failed node: the error explained (#323)
Board: boards/live-run/ErrorExplained.dc.html (in the repository, not on the docs site).
- What a failed node shows:
- a plain-language headline;
- a category;
- how sure ODS is: known pattern + evidence, known pattern or not recognised;
- why ODS thinks so, from its own evidence: what changed, column lineage, the manifest, source versions and run history;
- where (source file and line);
- what to try, with copyable commands;
- the impact on downstream nodes.
- dbt's own message stays one click away, with literal values and SQL removed.
- An unrecognised error never gets a guessed cause. The card shows what ODS knows instead.
- Built: the explanations, the terminal and JSON output (
ods state run,build,testandhistory --run, ADR-0025), and the card on the Run page's Nodes tab and in the Runs side panel, with Copy buttons and dbt's message in a disclosure (open when the error isn't recognised). "Ask the ODS agent to investigate" is shown disabled, as planned (M6).
Dark versions
| Home | Lineage |
|---|---|
 |
 |
| Model page | Plan |
 |
 |
Decisions taken from the dbt platform review
- Naming:
- Keep
ods stateas the CLI. The dashboard section's name is still open; the leading candidate is Builds. - Rename Mesh to Projects.
- Don't use Catalog or Explorer as product names.
ods servegrows into this read-only dashboard.- No scheduler. Show runs instead, starting with local runs from the state store.
- Lag tolerance and cost savings: in scope, shown next to the plan.
- Health signals: in scope, as static badges from run, test and freshness evidence.
- Semantic layer: read-only, through a generic source so other build tools can supply it.
- Identity, webhooks and audit: deferred. They appear as placeholders, designed as event sinks.
Still to design
- Usage, CI · Impact, Agent and History pages.
- Empty and error states for a project with no state store.
- Narrow screens.
- Live run: dark mode, the Home "run in progress" banner, and several runs at once.