Image diff
rich_art::imagediff compares two images the way a person would: it reports
how much of the picture changed perceptibly, and ranks the regions that
changed. It is the library behind rich diff before.png after.png. It needs
the image feature.
Use it for visual regression tests: comparing a rendered screenshot, chart or UI capture against a baseline, where a byte-for-byte comparison would fail on every anti-aliasing or re-encoding difference.
This page covers the Rust API. For the command line — the output, the drawing modes and the CI gate — see Comparing images.
The smallest example
The examples draw a pair of "screenshots" in code. The second adds a white badge:
/// A 160×100 "screenshot": a dark gradient, a disc, and optionally a badge in
/// the given colour. Adding or recolouring the badge is the change to find.
fn screenshot(badge: Option<[u8; 3]>) -> DynamicImage {
    DynamicImage::ImageRgb8(RgbImage::from_fn(160, 100, |x, y| {
        let (dx, dy) = (x as f32 - 45.0, y as f32 - 50.0);
        if dx * dx + dy * dy <= 28.0 * 28.0 {
            return Rgb([250, 205, 40]); // the disc: identical in both
        }
        if let Some(colour) = badge {
            if (100..140).contains(&x) && (30..70).contains(&y) {
                return Rgb(colour); // the badge
            }
        }
        Rgb([
            (20 + x * 60 / 159) as u8,
            (30 + y * 50 / 99) as u8,
            (90 - x * 40 / 159) as u8,
        ])
    }))
}
Compare them and print the report:
let before = screenshot(None);
let after = screenshot(Some([245, 245, 245]));
let report = diff(&before, &after, &DiffSettings::default()).expect("same size");

console.print_str(&format!(
    "{:.1}% changed perceptibly (a plain pixel diff would say {:.1}%)",
    report.changed_fraction * 100.0,
    report.naive_changed_fraction * 100.0,
));
let mut table = Table::new();
table.add_column("Region");
table.add_column_justify("Share", Justify::Right);
table.add_column_justify("Mean ΔE", Justify::Right);
for region in &report.regions {
    table.add_row(&[
        &format!(
            "{}×{} at ({}, {})",
            region.width, region.height, region.x, region.y
        ),
        &format!("{:.0}%", region.share_of_change * 100.0),
        &format!("{:.1}", region.mean_delta_e),
    ]);
}
console.print(&table);
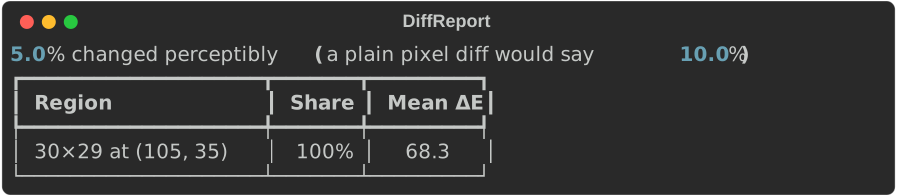
A plain pixel comparison counts every pixel of the badge: 10% of the canvas. The perceptual figure is lower, 5%, because blurring softens the badge's edges below the ΔE threshold and only its core counts. Either way there is exactly one region, and it holds all of the change. On real screenshots the gap is much wider: anti-aliasing and re-encoding noise inflate the plain figure, and the blur removes them.
How it decides
- Blur both images (
blur, default radius 6), so sub-pixel noise and re-encoding artefacts stop counting as change. - Convert to CIELAB, where distance approximates perceived difference.
- ΔE per pixel (CIE76), and mark pixels above
threshold(default 60). - Morphological open (erode, then dilate) with an
open_kernel×open_kernelsquare (default 11), dropping speckle. - Label connected regions, drop those under
min_regionpixels (default 400), and rank the rest by area × severity. Keep thetop(default 3).
Comparing images explains why each step is there.
The report
diff(&before, &after, &settings) returns a DiffReport:
| Field | Meaning |
|---|---|
width, height |
The image size. |
changed_fraction |
Share of pixels (0–1) above the ΔE threshold, measured before the open. |
naive_changed_fraction |
Share a plain byte comparison would call changed (any channel off by more than 32), on the unblurred images. |
mean_delta_e, max_delta_e |
Over the whole image. |
regions |
Ranked Regions: x, y, width, height, area_px (after the open), share_of_change (0–1) and mean_delta_e. |
delta_e |
Per-pixel ΔE, row-major, width * height long. |
share_of_change is the region's part of all changed pixels, including
regions too small to list, so the shares need not add up to 100%.
mean_delta_e says how strong a change is, independent of its size.
Pictures
Two helpers turn a report into an image you can draw with
ImageArt or save with the image crate:
let (before, after) = (screenshot(None), screenshot(Some([245, 245, 245])));
let report = diff(&before, &after, &DiffSettings::default()).expect("same size");
let view = |image: DynamicImage| ImageArt::new(image).mode(ImageMode::Blocks).width(30);

let mut grid = Table::grid().padding(0, 2, 0, 0);
for _ in 0..3 {
    grid.add_column("");
    grid.column_width(30);
}
grid.add_row_cells(
    ["after", "report.heatmap()", "report.highlight(&after)"]
        .into_iter()
        .map(|label| Cell::from(Text::styled(label, "bold")))
        .collect(),
);
grid.add_row_cells(vec![
    Cell::Renderable(Arc::new(view(after.clone()))),
    Cell::Renderable(Arc::new(view(report.heatmap()))),
    Cell::Renderable(Arc::new(view(report.highlight(&after)))),
]);
console.print(&grid);
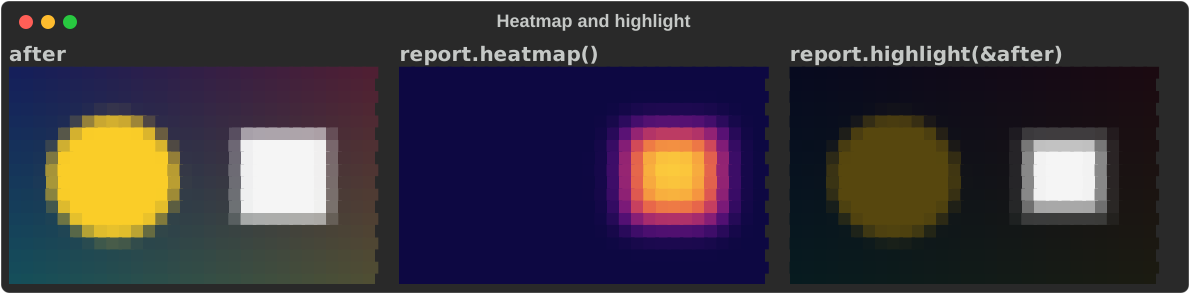
heatmap()maps ΔE from dark blue through magenta to yellow. The scale is normalised to this image's range, so a small intense change is still visible.highlight(&after)dims the after image except inside the reported regions: the "where" at a glance.
Gates and tuning
A gate compares changed_fraction with a limit:
// A CI gate: fail when more than 2% of the canvas changed perceptibly.
let before = screenshot(None);
let after = screenshot(Some([245, 245, 245]));
let report = diff(&before, &after, &DiffSettings::default()).expect("same size");
let limit = 2.0;
let changed = report.changed_fraction * 100.0;
if changed > limit {
    console.print_str(&format!(
        "[red]FAIL[/] {changed:.1}% changed, limit {limit:.1}%"
    ));
} else {
    console.print_str(&format!("[green]OK[/] {changed:.1}% changed"));
}
The defaults were tuned on regenerated artwork, which is noisy. Screenshots are
much cleaner, so a lower threshold and a smaller min_region catch subtler
changes:
// Screenshots are far cleaner than regenerated artwork, so a lower ΔE
// threshold and a smaller minimum region suit them.
let strict = DiffSettings {
    threshold: 10.0,
    min_region: 50,
    top: 5,
    ..DiffSettings::default()
};
// A subtle recolour: light grey to white.
let (grey, white) = (
    screenshot(Some([200, 200, 200])),
    screenshot(Some([245, 245, 245])),
);
for (label, settings) in [("default", DiffSettings::default()), ("strict", strict)] {
    let report = diff(&grey, &white, &settings).expect("same size");
    console.print_str(&format!(
        "{label:>7}: {:.1}% changed, {} region(s)",
        report.changed_fraction * 100.0,
        report.regions.len()
    ));
}
Images of different sizes are an error rather than a meaningless result:
let small = DynamicImage::ImageRgb8(RgbImage::new(80, 50));
match diff(&screenshot(None), &small, &DiffSettings::default()) {
    Err(DiffError::SizeMismatch { before, after }) => {
        console.print_str(&format!("cannot compare {before:?} with {after:?}"))
    }
    Ok(_) => unreachable!("sizes differ"),
}

Gotchas
- Align and crop both images to the same size first;
diffwill not resize. changed_fractionandregionsmeasure different things (before and after the open), so a small change can have a non-zero fraction and no regions.- The CLI rounds both percentages to one decimal before applying
--threshold. Round the same way if your gate must agree with it.
See also
- Comparing images —
rich difffor images, and why a perceptual diff - Images — drawing the heatmap and highlight
- The
diff_reportexample prints a report as JSON:cargo run -p rs-rich-art --features image --example diff_report -- before.png after.png