Diagnostics
rich_ext::diagnostic::Diagnostic renders errors the way compilers do:
with optional source snippets, labelled spans, suggested edits, notes, help and a stack trace. The same module family parses stack traces from Rust, Python, Java and JavaScript, installs a rich panic hook, and summarises many diagnostics in a dashboard.
Use it for anything that reports a problem to a person: a CLI that rejects a config file, a linter, a build tool, a failed request in a log.
No feature flag is needed. Enable anyhow for Diagnostic::from_anyhow.
Nothing is read behind your back
A diagnostic renders only what you give it. It never opens source files, reads the clock or inspects the environment, so the same diagnostic renders the same way everywhere.
The smallest diagnostic
let diagnostic = Diagnostic::error("mismatched types")
    .code("E0308")
    .location(Location::new("src/main.rs", Some(12), Some(5)))
    .cause("expected `u16`, found `&str`");
console.print(&diagnostic);
![error[E0308] header, location and cause](../../../media/guide/guide_diagnostics-quickstart.svg)
A Diagnostic is a builder: every method takes self and returns it. It
implements Renderable, so print it like any other renderable.
Levels and codes
Diagnostic::error and Diagnostic::warning set the level for you; any level
can be set with .level(Level::…). The level is the header's first word and
picks its colour.
console.print(&Diagnostic::error("cannot open `app.toml`"));
console.print(&Diagnostic::warning("`timeout` is deprecated"));
console.print(&Diagnostic::new("using 4 worker threads").level(Level::Info));
console.print(&Diagnostic::new("defaults came from /etc/acme").level(Level::Note));
console.print(&Diagnostic::new("run `acme check` to validate").level(Level::Help));
// No level: the message alone, styled `diagnostic.message`.
console.print(&Diagnostic::new("config rejected").code("CFG"));
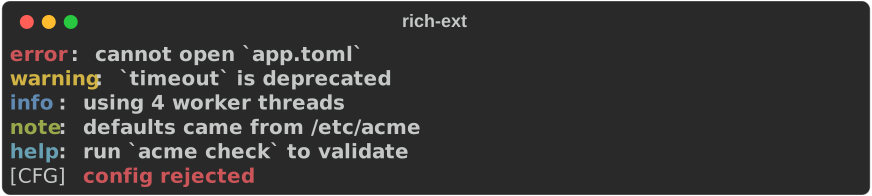
.code("E0308")shows aserror[E0308]..code_url(url)links the code to its documentation.- Without a level, the header is just the message (with
[CODE]in front if there is a code), in thediagnostic.messagestyle. Levelis ordered:Error < Warning < Info < Note < Help, most serious first. The dashboard uses that order to filter.
Compact and expanded views
A diagnostic has two views, chosen with .view(EventView::…):
| View | Shows |
|---|---|
Compact (default) |
header, --> location, caused by: lines |
Expanded |
all of that, then labels, source snippets, metadata, notes, help, suggestions and the stack trace |
Snippets, notes and help need the expanded view
If a snippet or help: line is missing from your output, you are almost
certainly rendering the compact view. Add .view(EventView::Expanded).
Source snippets, labels and suggestions
A SourceSnippet quotes the source you supply and underlines byte ranges of
it: ^^^ for primary spans, --- for secondary ones, each with an optional
label. A Suggestion shows a line as it would read after an edit.
let source = "[server]\nport = invalid\nhost = \"localhost\"\n";
let value = source.find("invalid").unwrap();
let key = source.find("port").unwrap();

let snippet = SourceSnippet::new("config.toml".into(), source.into(), value..value + 7, 1)
    .expect("span on UTF-8 boundaries")
    .primary_label("not a number")
    .secondary(key..key + 4, "for this key")
    .expect("span on UTF-8 boundaries");
let fix = Suggestion::replace("for example", source, value..value + 7, "8080")
    .expect("span on UTF-8 boundaries");

let diagnostic = Diagnostic::error("invalid endpoint")
    .code("CFG001")
    .code_url("https://acme.dev/errors/CFG001")
    .location(snippet.location())
    .cause("port must be numeric")
    .snippet(snippet)
    .note("ports below 1024 need privileges")
    .help("use a port from 1 to 65535")
    .suggestion(fix)
    .hyperlinker(Hyperlinker::new())
    .view(EventView::Expanded); // show everything below the header
console.print(&diagnostic);
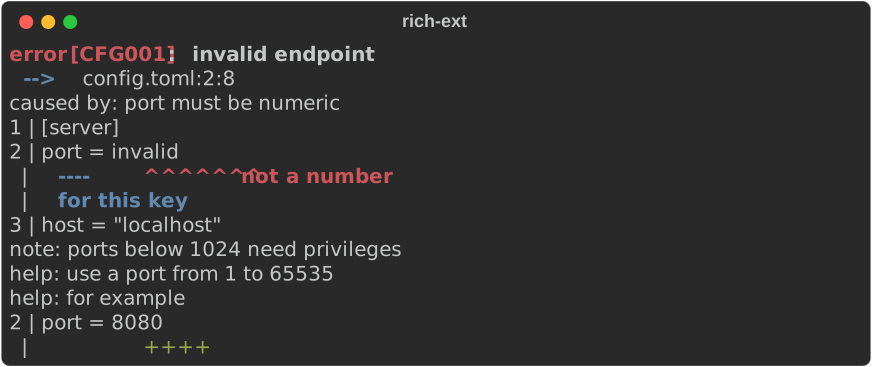
SourceSnippet::new(name, source, span, context_lines):
spanis a byte range intosource. It must lie on UTF-8 character boundaries; otherwisenew,primaryandsecondaryreturnErr(DiagnosticError::InvalidSpan).context_linesis how many unmarked lines to show around the marked ones.primary_labellabels the first span;primary(span, label)andsecondary(span, label)add more. A label sits after the rightmost marker on a line; the others get their own row below.location()returns the 1-based line and column (in characters) of the first span, handy for.location(...). Without an explicit location,get_location()falls back to it.- Tabs are expanded and a span that starts inside a grapheme cluster marks the whole cluster, so markers line up under wide and combining characters.
- At narrow widths the source row and its marker row are cropped together, so markers never drift under the wrong column.
Suggestion::new(message) is a help: line; Suggestion::replace(message,
source, span, replacement) also prints the edited line with +++ under the
replacement.
Other builders:
| Builder | Output |
|---|---|
.location(Location::new(path, line, column)) |
--> path:line:column, linked when a Hyperlinker is set |
.cause(message) |
caused by: message (compact view too) |
.note(message), .help(message) |
note: …, help: … |
.label(message) |
a free-standing line in the expanded view |
.metadata(key, Value) |
key=value in the expanded view |
.hyperlinker(Hyperlinker::new()) |
links the location, snippet names and trace frames |
.overflow(OverflowPolicy::…) |
how long lines fit the width (default Fold) |
From an error type: DiagnosticInfo
Building diagnostics by hand at every error site gets old. Implement
DiagnosticInfo on your error type instead, and every value of it knows how to
become a diagnostic. Every method has a default, so implement only what you
have. It works well with a thiserror enum:
#[derive(Debug, thiserror::Error)]
enum ConfigError {
    #[error("port {0:?} is not a number")]
    BadPort(String),
    #[error("cannot read the config")]
    Read(#[from] std::io::Error),
}

impl DiagnosticInfo for ConfigError {
    fn code(&self) -> Option<String> {
        Some(match self {
            ConfigError::BadPort(_) => "C001".into(),
            ConfigError::Read(_) => "C002".into(),
        })
    }
    fn code_url(&self) -> Option<String> {
        self.code()
            .map(|code| format!("https://acme.dev/errors/{code}"))
    }
    fn help(&self) -> Option<String> {
        matches!(self, ConfigError::BadPort(_)).then(|| "use a number such as 8080".into())
    }
    fn location(&self) -> Option<Location> {
        Some(Location::new("app.toml", Some(2), None))
    }
}
let error = ConfigError::BadPort("eighty".into());
console.print(&error.to_diagnostic().view(EventView::Expanded));

let io = std::io::Error::new(std::io::ErrorKind::NotFound, "no such file");
console.print(&ConfigError::from(io).to_diagnostic());
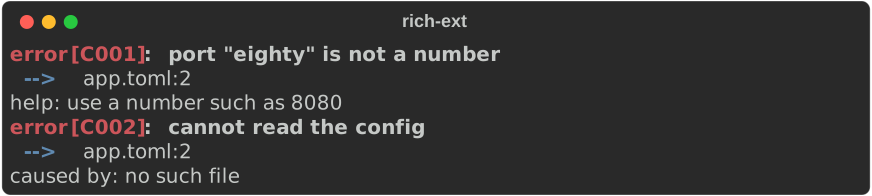
- The message is the error's
Display. - The
source()chain becomescaused by:lines.to_diagnostic()follows up to 16 causes;Diagnostic::from_info(&error, max_depth)sets the limit. - The trait methods are
level(defaultError),code,code_url,help,notesandlocation. - The result is an ordinary
Diagnostic: keep adding snippets or suggestions.
For an error that does not implement the trait,
Diagnostic::from_error(&error, max_depth) maps just the message and causes.
Past max_depth it adds a [truncated] cause, and a source chain that loops
back on itself ends with [cycle].
From anyhow (feature anyhow)
use anyhow::Context;

let error = std::fs::read_to_string("/etc/acme/missing.toml")
    .context("reading the config")
    .context("starting the server")
    .unwrap_err();
console.print(&Diagnostic::from_anyhow(&error, 8));

The outermost context is the message and each inner context is a cause. When
the anyhow::Error captured a backtrace (RUST_BACKTRACE=1), it becomes the
diagnostic's stack trace, shown in the expanded view.
Stack traces
stacktrace::parse recognises a Rust, Python, Java or JavaScript trace and
normalises it into one StackTrace:
kindandmessage(ValueError,bad config);frames, most recent call last in every language, each withfunction,path,line,column, the quotedsourceline when there is one, and alibraryflag for standard-library, runtime and dependency frames;cause: the chained error (Pythonraise … fromand implicit chaining, JavaCaused by:, JavaScript[cause]), withcause_kindsaying which relation it is.
let trace = stacktrace::parse(PYTHON_TRACE).expect("a Python traceback");
assert_eq!(trace.chain().count(), 2); // ValueError, caused by KeyError
let origin = trace.origin().expect("an application frame");
assert_eq!(origin.function.as_deref(), Some("main"));
console.print(&trace);
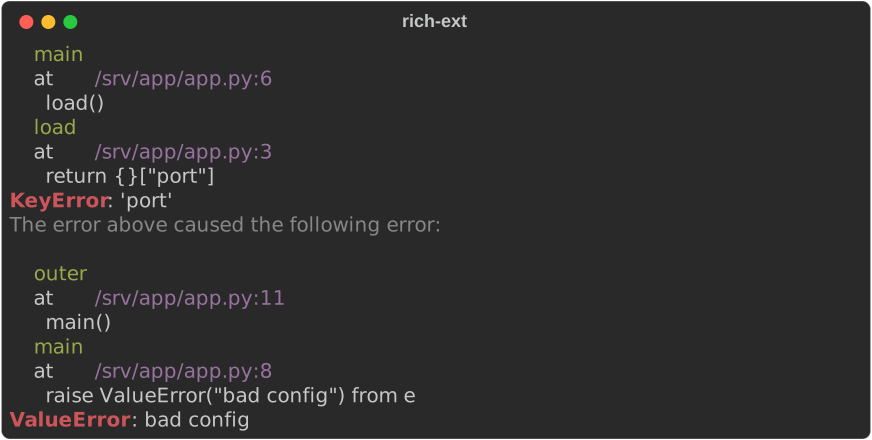
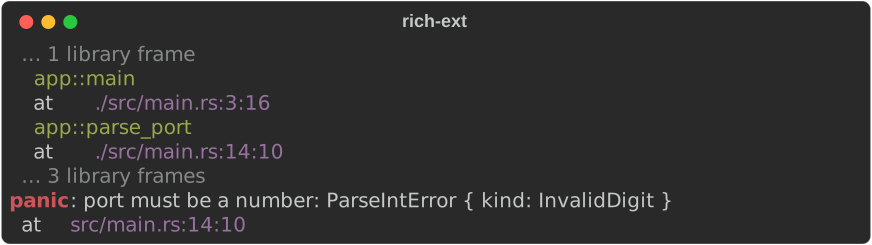
Causes print first, then the error they caused, like Python does. Library
frames are dimmed and runs of them collapse into … N library frames:
let trace = stacktrace::parse(RUST_PANIC).expect("a Rust panic");
console.print(&trace);
// Every frame, and plain paths instead of links:
let _all = trace
    .render_options()
    .show_library(true)
    .hyperlinker(Hyperlinker::disabled());
| Method | Purpose |
|---|---|
trace.origin() |
The most recent application frame: where to look first |
trace.chain() |
This trace, then its causes |
trace.render_options() |
A StackTraceView to configure |
.show_library(true) |
Show every library frame |
.hyperlinker(linker) |
Link frame locations (default: file:// links) |
Traces are untrusted input, so the parsers and views are bounded and inert:
- The built-in parsers keep at most
stacktrace::MAX_CAUSES(64) causes below the outermost error, the ones nearest it, and count the rest inStackTrace::omitted_causes. The view applies the same cap to a chain you build yourself and prints… N more causesin place of the rest. Chains render and drop without recursion, so any length is safe. - Locations, function names, source lines, kinds and messages show terminal
controls as inert symbols (
␛), so a crafted trace cannot retitle the window or break out of a link.
What counts as a library frame:
| Language | Library when |
|---|---|
| Rust | the function is in std, core, alloc or backtrace (or is a __rust… symbol), or the path is under /rustc/ or .cargo/registry |
| Python | the path contains site-packages or /lib/python, or starts with < (<frozen …>) |
| Java | the class is in java., javax., jdk., sun., com.sun. or kotlin. |
| JavaScript | the path starts with node: or contains node_modules |
Your own trace format
Each language is a TraceParser. Add one with Parsers::with_parser; it is
tried before the built-in parsers:
use rich_ext::stacktrace::{Frame, Language, Parsers, StackTrace, TraceParser};

/// Traces of the form `tiny error: message`, then `  at function (path:line)` lines.
struct TinyParser;

impl TraceParser for TinyParser {
    fn detect(&self, text: &str) -> bool {
        text.starts_with("tiny error: ")
    }

    fn parse(&self, text: &str) -> Option<StackTrace> {
        let mut lines = text.lines();
        let mut trace = StackTrace::new(Language::Other("tiny".into()));
        trace.kind = Some("tiny error".into());
        trace.message = lines.next()?.strip_prefix("tiny error: ").map(Into::into);
        for line in lines {
            let (function, place) = line.trim().strip_prefix("at ")?.split_once(" (")?;
            let (path, line) = place.trim_end_matches(')').rsplit_once(':')?;
            trace.frames.push(Frame {
                function: Some(function.into()),
                path: Some(path.into()),
                line: line.parse().ok(),
                ..Frame::default()
            });
        }
        trace.frames.reverse(); // most recent call last, like every parser
        Some(trace)
    }
}
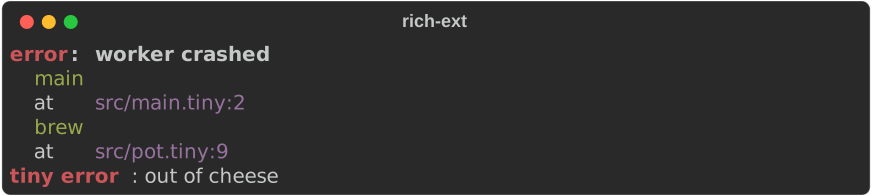
let parsers = Parsers::new().with_parser(TinyParser);
let text =
    "tiny error: out of cheese\n  at brew (src/pot.tiny:9)\n  at main (src/main.tiny:2)";
let trace = parsers.parse(text).expect("TinyParser detects it");
let diagnostic = Diagnostic::error("worker crashed")
    .trace(trace)
    .view(EventView::Expanded); // traces show in the expanded view
console.print(&diagnostic);
A rich panic hook
stacktrace::panic_hook(console) returns a hook that prints a panic as a
StackTrace. Installing it is up to you:
fn install_panic_hook() {
    let console = Console::builder()
        .force_terminal(std::io::IsTerminal::is_terminal(&std::io::stderr()))
        .build();
    std::panic::set_hook(Box::new(stacktrace::panic_hook(console)));
}
stacktrace::capture(message)builds the current thread's trace withBacktrace::force_capture, so the hook always has frames, whateverRUST_BACKTRACEsays. File locations need debug info.- The hook prints to the console you give it. Give it a stderr console (as above) to keep panics off standard output.
- The captured trace currently includes the hook's own frames
(
panic_hook::{closure},capture) and the C runtime's start-up frames as application frames. Try it:cargo run -p rs-rich-ext --example guide_diagnostics --features anyhow -- --panic.
Many diagnostics at once
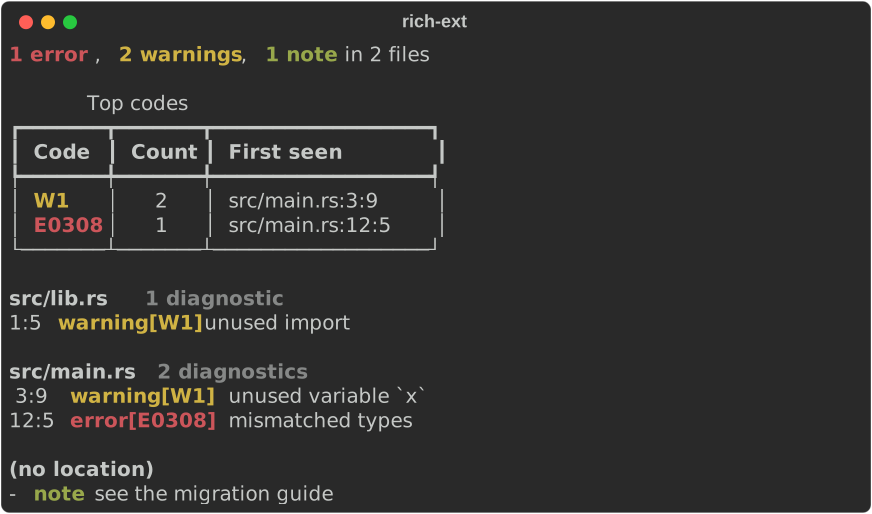
dashboard::DiagnosticsDashboard takes many diagnostics and prints one
overview: counts by level, the most frequent codes, then every diagnostic
grouped by file in line order.
use rich_ext::dashboard::DiagnosticsDashboard;

let at = |path: &str, line, column| Location::new(path, Some(line), Some(column));
let mut dashboard = DiagnosticsDashboard::new().top_codes(3);
dashboard
    .push(
        Diagnostic::error("mismatched types")
            .code("E0308")
            .location(at("src/main.rs", 12, 5)),
    )
    .push(
        Diagnostic::warning("unused variable `x`")
            .code("W1")
            .location(at("src/main.rs", 3, 9)),
    )
    .push(
        Diagnostic::warning("unused import")
            .code("W1")
            .location(at("src/lib.rs", 1, 5)),
    )
    .push(Diagnostic::new("see the migration guide").level(Level::Note));
console.print(&dashboard);
| Builder | Default | Effect |
|---|---|---|
push(d), extend(ds) |
Add diagnostics (take &mut self) |
|
min_level(Level::Warning) |
all | Hide less serious diagnostics |
top_codes(n) |
5 | Rows in the top-codes table; 0 hides it |
hyperlinker(linker) |
none | Link file headings and locations |
counts() returns the per-level totals as a BTreeMap, for exit codes or CI
summaries. Diagnostics without a level count as errors; ones without a location
are listed under (no location).
Diagnostics in log events
A StructuredEvent can carry diagnostics under its message line. See
Logging.
Run the example
See also
- Logging: structured events and the
RichHandler. - Extensions:
Hyperlinkerand editor links, and thediagnostic.*andstacktrace.*theme keys. - CLI authoring: command-line errors rendered as diagnostics.
- Structured data: parse errors that convert to diagnostics.
- API:
diagnostic,DiagnosticInfo,stacktrace,DiagnosticsDashboard.