Diagrams (rs-rich-diagram)
rs-rich-diagram (rich_diagram, new in 0.0.15) draws graphs in the
terminal: a graph model, a layered layout, and a Diagram renderable that
draws the result with box-drawing characters, or ASCII. It also reads DOT
(Graphviz) sources natively (below). rich draws no
graphs, so this crate is an rs-rich addition, not a port; it depends on core
rs-rich only, and core is unchanged.
The layout is the one rs-rich-mermaid
has drawn flowcharts with since 0.0.12, lifted out so that every diagram
source draws the same way. A Mermaid flowchart is now converted into a
rich_diagram::Graph and drawn here, and a graph built in code draws exactly
as the equivalent Mermaid source does.
Building a graph in code
Graph's builder chains. node and edge add items; label changes
whichever was added last, shape the last node, and stroke, heads and
min_length the last edge. An edge to an id with no node yet adds one,
labelled with its id.
use rich::Console;
use rich_diagram::{Diagram, Direction, Graph, Shape, Stroke};

let graph = Graph::new(Direction::TopDown)
    .node("web", "Browser").shape(Shape::Round)
    .node("api", "API")
    .node("db", "Postgres").shape(Shape::Cylinder)
    .node("jobs", "Job queue")
    .node("worker", "Worker").shape(Shape::Subroutine)
    .edge("web", "api").label("HTTPS")
    .edge("api", "db").label("reads")
    .edge("api", "jobs").stroke(Stroke::Dotted)
    .edge("jobs", "worker")
    .edge("worker", "db").stroke(Stroke::Thick).label("writes");

Console::new().print(&Diagram::new(graph));
In Python the same graph is built with rs_rich.diagram.
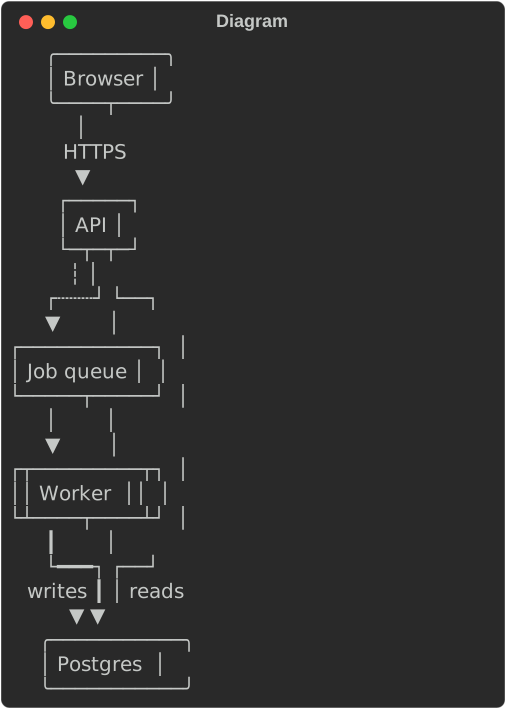
cargo run -p rs-rich-diagram --example services prints:
      ╭─────────╮
      │ Browser │
      ╰────┬────╯
           │
         HTTPS
           ▼
        ┌─────┐
        │ API │
        └─┬─┬─┘
          ┆ │
      ┌┄┄┄┘ └──┐
      ▼        │
┌───────────┐  │
│ Job queue │  │
└─────┬─────┘  │
      │        │
      ▼        │
┌┬─────────┬┐  │
││ Worker  ││  │
└┴────┬────┴┘  │
      ┃        │
      └━━━┐ ┌──┘
   writes ┃ │ reads
          ▼ ▼
     ╭───────────╮
     │ Postgres  │
     ╰───────────╯
Graph::from_parts(direction, nodes, edges) takes finished Nodes and
Edges instead, as a parser builds them.
The model
- Direction:
TopDown,BottomUp,LeftRightorRightLeft. - Nodes: an id, a label (
\nbreaks a line) and aShape:Rect,Round,Stadium,Subroutine,Cylinder,Circle,DoubleCircle,Asymmetric(a flag),Rhombus(a decision diamond),Hexagon,Parallelogram,ParallelogramAlt,TrapezoidandTrapezoidAlt. Each is a box whose corners and sides suggest the shape. - Edges: a source and a target, an optional label, a
Stroke(Solid,Thick,Dotted, orInvisible: laid out but not drawn), aHeadat each end (None,Arrow,Circle,Cross), and a minimum number of ranks to span (at most 10).edgeadds an arrow;linkadds an undirected edge, with no heads;heads(Head::Arrow, Head::Arrow)makes it two-way.
Clusters (subgraph frames) are not drawn yet: the layout lays every node out in one graph, as Mermaid's subgraphs always have been. DOT clusters are parsed and listed in a note under the drawing.
Two more sources draw through this layout from the CLI: rich deps --graph
(Cargo dependencies) and DOT. See
Dependency graphs and JSON Schemas for rich deps and
rich schema.
The layout
rich_diagram::draw(&graph, ascii) returns a Drawing: plain lines of text
and their width. The layout is layered (Sugiyama-style):
- cycles are broken by reversing the edges a depth-first search finds going back, and nodes are ranked by longest path;
- edges spanning several ranks get one-cell dummy points;
- each rank is ordered by barycentre sweeps, keeping the order with the fewest crossings;
- nodes are placed along the rank by averaging their neighbours' centres;
- every edge is routed orthogonally, with its own port on a node and its own track in the gap between two ranks.
A self-loop is marked ↻ (@ in ASCII). The layout refuses, before any
layout work, graphs of more than 2000 edges (rich_diagram::MAX_EDGES) or
5000 nodes; then graphs needing more than 5000 points (nodes, plus one per
rank a long edge crosses) and drawings over 2 million cells. Diagram shows
a one-line note instead; nothing is drawn in part.
Width and ASCII
The layout takes no width: a drawing is as wide as the graph needs. Diagram
measures to that width, so it sits in a Table cell, a Panel or
Columns like any renderable, and given less it crops: each line is cut
at the right edge and rows left empty are dropped. The output never exceeds
the width it is given, and the same graph at the same width always crops the
same way. Diagram::drawing gives the whole drawing when you want to scroll
or page it instead. (Mermaid adds a note saying how much it cropped; the
lines above the note are the same.)
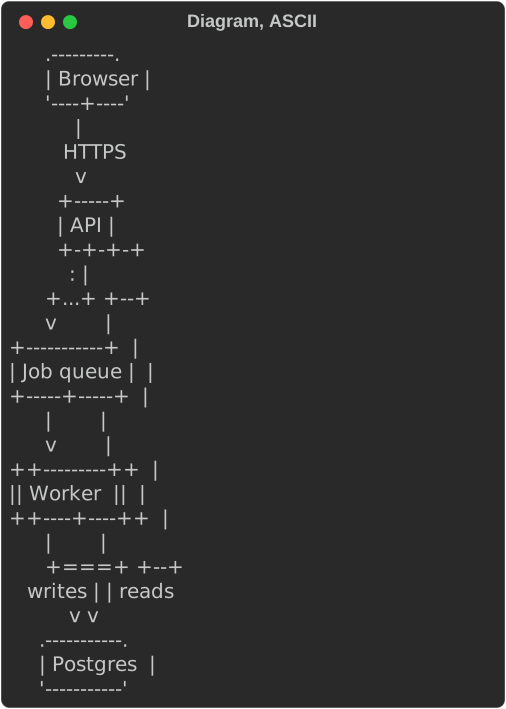
ASCII follows the console (Console::ascii_only, set for a non-UTF
encoding) unless you choose with Diagram::ascii(true). The same graph, with
cargo run -p rs-rich-diagram --example services -- 80 ascii:
      .---------.
      | Browser |
      '----+----'
           |
         HTTPS
           v
        +-----+
        | API |
        +-+-+-+
          : |
      +...+ +--+
      v        |
+-----------+  |
| Job queue |  |
+-----+-----+  |
      |        |
      v        |
++---------++  |
|| Worker  ||  |
++----+----++  |
      |        |
      +===+ +--+
   writes | | reads
          v v
     .-----------.
     | Postgres  |
     '-----------'
Labels have their control characters removed before drawing, so a label from untrusted input cannot reach the terminal as an escape sequence.
DOT (Graphviz)
rich_diagram::dot reads the DOT people write by hand and draws it through
the same layout, natively: no Graphviz needed.
use rich::Console;
use rich_diagram::Dot;

let source = std::fs::read_to_string("services.dot").unwrap();
Console::new().print(&Dot::new(source));
dot::parse(source) gives the DotGraph instead: the Graph, whether it is
directed and strict, its name and label, its clusters, and notes on what
was accepted but is not drawn.
Supported:
graphanddigraph, optionallystrict(repeated edges merge into one), named or not;- node statements (
a [label="A", shape=box]) and edge statements, chains included (a -> b -> c), with{ … }groups as endpoints (a -> { b c }); - attribute lists, and
node [ … ],edge [ … ]andgraph [ … ]defaults, scoped to the subgraph they are set in. Nodes takelabel(\n,\land\rbreak lines;\Nis the node's name,\Gthe graph's) andshape; edges takelabel(\Tis the tail's name,\Hthe head's,\Ethe edge's,a->b; an escape the object has no name for stands for its letter, as in Graphviz),style(dashed/dotteddraw dotted,boldthick,invislaid out but not drawn),dir,arrowhead,arrowtailandminlen; the graph takesrankdir(TB,LR,BT,RL) andlabel, drawn under the graph; - subgraphs; one named
cluster…is a cluster, with itslabel; - quoted IDs (with
+concatenation), numerals (lexed as Graphviz lexes them:1.2.3is1.2then.3, and a.without a digit is an error), and//,/* */and#comments, anywhere between tokens.
Shapes map to the nearest box: box/rect → Rect, ellipse (the
default) and style=rounded → Round, circle → Circle, diamond →
Rhombus, cylinder → Cylinder, hexagon → Hexagon, parallelogram,
trapezium, component → Subroutine, and so on; an unknown shape is a
box, as Graphviz draws it. Attributes that only change how Graphviz paints
(color, fontname, penwidth, …) are accepted and ignored.
Refused, with an error naming the construct and its line, never drawn
partially: node ports (a:out -> b), HTML-like labels (label=<…>), the
record and Mrecord shapes, a subgraph referred to without a body, and
more than one graph in a file. So are sources past the parser's bounds, the
same as Mermaid's: over 64 KB (rich_diagram::MAX_SOURCE), more than 500
nodes (MAX_NODES) or 2000 edges (MAX_EDGES, counted as { … } groups
expand, so {a b c} -> {d e f} is nine; repeats a strict graph merges
do not count), or { … } groups and subgraphs nested more than 64 deep
(dot::MAX_NESTING):
The Dot renderable shows that message under a dim DOT: note, with the
source; rich dot prints it as an error and exits 4.
Accepted but not drawn: cluster frames (the nodes are laid out with the
rest, and a note names each cluster's members) and rank constraints. Both
come with a note under the drawing. Drawn differently, with a note naming
the nodes: invisible nodes (style=invis) are drawn, and nodes without an
outline (shape=plaintext, plain, none) are drawn in a box: the layout
has no borderless shape. With ASCII, the notes are ASCII too (... for
…).
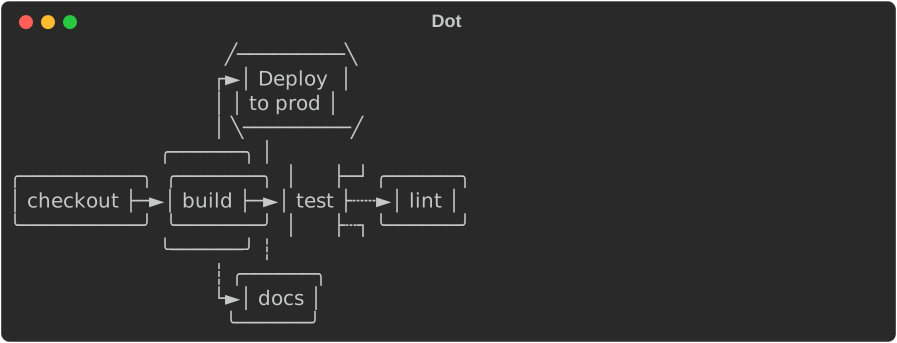
The service map in crates/rich-diagram/tests/fixtures/dot/services.dot:
// A small service map, the way people sketch one by hand.
digraph services {
  rankdir=LR
  label="Request path"
  node [shape=box, fontname="Helvetica"]

  web [label="Browser", shape=ellipse]
  subgraph cluster_backend {
    label = "Backend"
    api [label="API"]
    db  [label="Postgres", shape=cylinder]
    api -> db [label="reads"]
  }
  cache [shape=diamond, label="Cache?"]

  web -> api [label="HTTPS"]
  api -> cache [style=dashed]
  cache -> db [style=bold, label="miss"]
}
draws as:
                               ╱────────╲
                     ┌─────┐ ┌►< Cache? >━┐        ╭──────────╮
╭─────────╮ ┌─HTTPS─►│ API ├┄┘ ╲────────╱ └━miss━━►│ Postgres │
│ Browser ├─┘        │     ├─┐            ┌─reads─►│          │
╰─────────╯          └─────┘ └────────────┘        ╰──────────╯
Request path
DOT: clusters are drawn without their frames: Backend (api, db)
The plugin and the CLI
With the plugin feature, rich_diagram::plugin::DotPlugin registers dot
and graphviz fence renderers and a dot source renderer, as
rs-rich-mermaid registers Mermaid. The rich CLI includes it:
rich dot services.dot           # alias: rich graphviz; .dot and .gv files are detected
rich README.md                  # ```dot fences draw as diagrams
rich README.md --dot-backend off   # ... or stay code blocks, as upstream renders them
DOT in Markdown and dependency trees are recorded in a terminal.
Graphviz's own SVG
The graphviz feature adds rich_diagram::graphviz::render_svg, which runs
Graphviz's dot -Tsvg (installed separately) for its full layout. The
source goes to dot on its standard input, never through a shell; the
process gets a timeout (20 s) and size caps on what goes in (256 KiB) and
comes out (16 MiB).
In the CLI, --dot-backend graphviz makes --export-svg OUT.svg write
Graphviz's SVG instead of the text drawing's, while the terminal still shows
the native drawing:
Like mmdc for Mermaid, it only runs where you chose it: on the command
line, or in your own config (~/.config/rich/config.toml or --config). A
project's ./rich.toml with dot_backend = "graphviz" is ignored with a
warning, so a cloned repository's rich.toml cannot make rich start
Graphviz or any other program it names. Without dot installed the export
falls back to the text drawing's SVG with a warning.
One command does run a program for the directory it is in: rich deps
without --metadata FILE runs cargo metadata, and Cargo reads that
project's .cargo/config.toml. rich deps turns off the rustc wrappers
such a file can name, but the rest is Cargo's behaviour (see
Running Cargo); in a checkout you do not
trust, use cargo metadata output you made yourself, with --metadata
FILE, which runs nothing.
From Mermaid
The Mermaid source for the first graph draws the same lines:
graph TD
  web(Browser) -->|HTTPS| api[API]
  api -->|reads| db[(Postgres)]
  api -.-> jobs[Job queue]
  jobs --> worker[[Worker]]
  worker ==>|writes| db
rich_mermaid::Flowchart::to_graph gives the Graph a parsed flowchart
draws through. Mermaid's tests check both directions: its snapshots built
with the builder, and random graphs written both ways.
From the shell, rich mermaid flow.mmd (alias mmd; .mmd and .mermaid
files are detected) draws a flowchart, and ```mermaid fences draw in
Markdown; --mermaid-backend mmdc renders every diagram type through
Mermaid's own CLI in a build with the mmdc feature. In Python, the same
graphs, DOT sources and Mermaid diagrams are
rs_rich.diagram
and rs_rich.mermaid.