Sorting, grouping and streaming tables
The core Table is a faithful port of upstream's: it lays out whatever rows
you give it, in the order you give them. rich_ext::table adds the data
operations upstream leaves to you, and a table for rows that keep changing:
TableData: typed rows under column definitions, with a stable multi-column sort, grouping with per-group aggregates, and a totals row.StreamingTable: rows under stable keys for append/update workloads under a live display. A frame re-renders only the rows that changed.sortandgroup: the same operations as functions over plain rows, for building a coreTableyourself.
Every view here builds core tables; none has its own table renderer. So the
output looks exactly like a core Table, box styles, column options, ASCII
fallback and all. No feature flag is needed.
Values and columns
A cell is a Value: Null, Int, Float, Str (literal text, never
markup) or Text (styled). The type decides how the cell sorts and
aggregates. The column decides how it looks:
fn services() -> TableData {
    let latency = |value: &Value| match value.as_f64() {
        Some(ms) => Text::new(format!("{ms:.0} ms")),
        None => Text::styled("-", "dim"),
    };
    let mut data = TableData::new([
        Column::new("service"),
        Column::new("region"),
        Column::new("errors").justify(Justify::Right),
        Column::new("p99").justify(Justify::Right).format(latency),
    ]);
    data.push([
        "api".into(),
        "eu".into(),
        Value::Int(3),
        Value::Float(120.0),
    ]);
    data.push(["web".into(), "us".into(), Value::Int(0), Value::Float(80.0)]);
    data.push(["db".into(), "eu".into(), Value::Int(7), Value::Null]);
    data.push([
        "cache".into(),
        "us".into(),
        Value::Int(1),
        Value::Float(4.0),
    ]);
    data.push([
        "worker-10".into(),
        "eu".into(),
        Value::Int(3),
        Value::Float(95.0),
    ]);
    data.push([
        "worker-9".into(),
        Value::Null,
        Value::Int(0),
        Value::Float(60.0),
    ]);
    data
}
Column::new(header)is left-justified..justify(..)sets the justification and.options(ColumnOptions { .. })sets any core column option (width, ratio,no_wrap, style, …)..format(|value| Text)controls how a column displays its values, as here for milliseconds or withrich_ext::formatfor byte sizes. Aggregates are displayed through the same formatter, except counts.Valueconverts from&str,String,Text, the integer types,f64andOption<T>(NoneisNull). A row shorter than the columns is padded withNull, and extra cells are dropped.
Sorting
sort_by takes SortKeys in priority order. Later keys break ties between
rows that are equal on the earlier ones:
// Region ascending, then errors descending; the null region sorts last.
let data = services().sort_by([SortKey::asc(1), SortKey::desc(2)]);
console.print(&data);
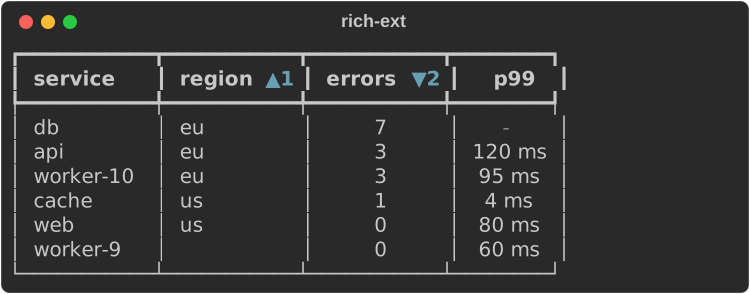
- Stable. Rows that are equal on every key keep the order they were added in.
- Empty cells last. A
Nullor empty string sorts after every other value in either direction, like the missing region above. - Natural by default. Numbers compare numerically, and so do strings that
are numbers (
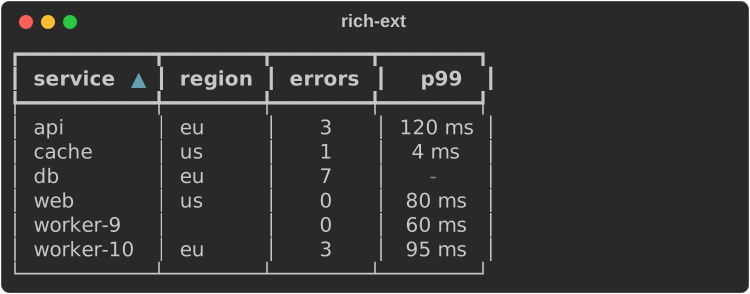
"10"after"9"). Other strings compare case-insensitively, with runs of digits compared by value, soworker-9sorts beforeworker-10. Numbers sort before text.SortKey::asc(i).lexical()compares the plain strings byte by byte instead. - Header indicators. Each sorted column's header gets
▲or▼(styledtable.sort_indicator). When there is more than one key, the indicator also shows the key's priority (▲1,▼2).
// Natural order: `worker-9` before `worker-10`.
console.print(&services().sort_by([SortKey::asc(0)]));
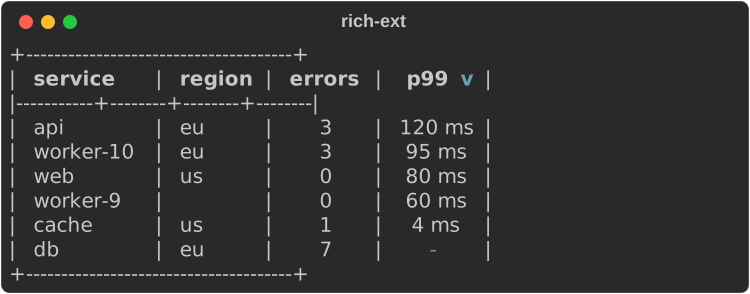
On a console that can only render ASCII, the indicators are ^ and v, and
the core table switches to an ASCII box:
// On an ASCII-only console (`Console::builder().ascii_only(true)`) the
// indicators read `^`/`v` and the core swaps in an ASCII box.
console.print(&services().sort_by([SortKey::desc(3)]));
Grouping and aggregates
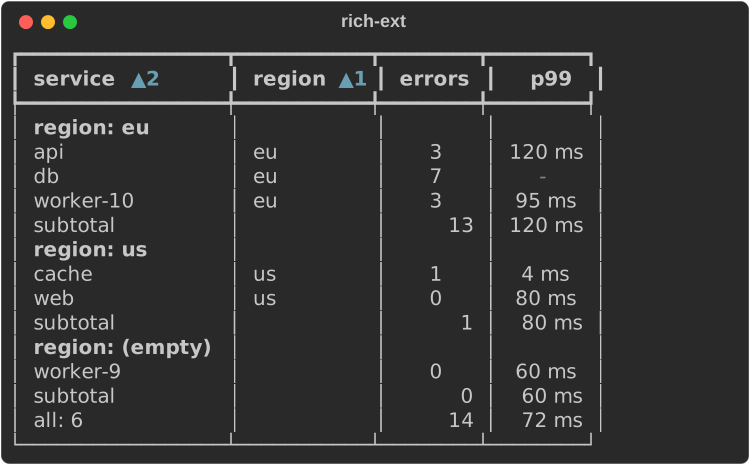
GroupBy::new(column) splits the rows into groups by the value in that
column. Each group renders as three parts:
- A header row. It holds the group's key in the first column, styled
table.group. When the grouped column is not the first column, the column's name is prefixed (region: eu). Empty cells form one group, shown as(empty). - The group's rows.
- A summary row with the group's aggregates, styled
table.aggregate. This row appears only when the grouping has aggregates.
Groups appear in the order of their first row. To get groups in key order, sort by the grouped column first.
let data = services()
    .sort_by([SortKey::asc(1), SortKey::asc(0)])
    .group_by(
        GroupBy::new(1)
            .aggregate(Aggregate::sum(2))
            .aggregate(Aggregate::max(3)),
    )
    .totals(
        "all",
        [Aggregate::count(0), Aggregate::sum(2), Aggregate::mean(3)],
    );
console.print(&data);
| Aggregate | Result |
|---|---|
Aggregate::count(col) |
The number of non-empty cells, shown as a plain integer |
Aggregate::sum(col) |
The sum of the numeric cells: an Int if every cell is an integer, otherwise a Float |
Aggregate::min(col), max(col) |
The smallest or largest non-empty cell, in natural order |
Aggregate::mean(col) |
The mean of the numeric cells |
Aggregate::custom(col, f) |
f(&[&Value]) -> Value over the group's cells |
Summary and totals rows:
- Each aggregate is placed in its own column. If a column has more than one
aggregate, they are joined with
,. - The summary label (
subtotalby default, set withGroupBy::label) goes in the first cell. If the first column has its own aggregate, the label is prefixed to it (all: 6). TableData::totals(label, aggregates)adds one final row computed over every row.
To compute groups without rendering them, call
GroupBy::groups(&rows, &order). It returns each group's key, its row
indices and its aggregate values.
Plain rows and a core Table
sort::sort_rows, sort::sorted_indices and sort::compare_rows work on any
rows that are AsRef<[Value]>, such as Vec<Vec<Value>>. They let you keep
building the core Table yourself:
use rich::Table;
use rich_ext::table::{sort::sort_rows, SortKey, Value};

let mut rows = vec![
    vec![Value::from("v1.10"), Value::Int(2)],
    vec![Value::from("v1.9"), Value::Int(5)],
];
sort_rows(&mut rows, &[SortKey::desc(1), SortKey::asc(0)]);
let mut table = Table::new();
table.add_column("version").add_column("n");
for row in &rows {
    table.add_row_text(row.iter().map(Value::to_text).collect());
}
Streaming tables
StreamingTable<K> keeps its rows under stable keys of type K, such as a
job name, a path or a sequence number:
| Method | Effect |
|---|---|
upsert(key, row) |
Adds a new key at the end. For an existing key, replaces the row in place, keeping its position |
update_cell(&key, col, value) |
Changes one cell |
remove(&key) |
Removes the row and returns its cells |
set_sort(keys) |
Shows the rows sorted (stable over insertion order), with indicators |
window(Window::Tail(n)) |
Shows the last n rows, below an … N earlier rows line |
window(Window::Head(n)) |
Shows the first n rows, above an … N more rows line |
capacity(n) |
Evicts the oldest rows beyond n. Evicted rows count as earlier rows |
fn jobs() -> StreamingTable<&'static str> {
    let mut jobs = StreamingTable::new([
        Column::new("job"),
        Column::new("state"),
        Column::new("done")
            .justify(Justify::Right)
            .format(|v| match v {
                Value::Int(n) => Text::new(format!("{n}%")),
                _ => Text::new(""),
            }),
    ])
    .title("pipeline")
    .window(Window::Tail(4)); // log-like: keep the newest rows on screen

    // Keys are stable: an upsert of a known key updates its row in place.
    for job in ["fetch", "build", "test", "lint", "docs"] {
        jobs.upsert(job, [job.into(), "queued".into(), Value::Int(0)]);
    }
    jobs.update_cell(&"build", 1, "running");
    jobs.update_cell(&"build", 2, Value::Int(45));
    jobs.upsert("fetch", ["fetch".into(), "done".into(), Value::Int(100)]);
    jobs
}
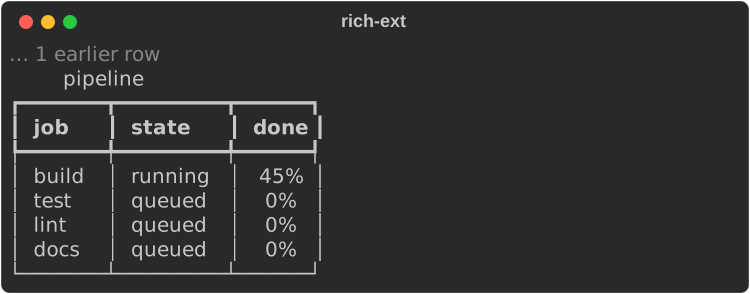
StreamingTable implements Renderable, so you can put it anywhere a
renderable goes, including a LiveCoordinator region (see
Live and layout):
fn run_live(target: RenderTarget) -> Result<(), LiveError> {
    let mut jobs = jobs();
    let mut live = LiveCoordinator::new(std::io::stdout(), target.clone());
    let region = live.add(target.segments(&jobs))?;
    live.refresh()?;

    for done in [60, 80, 100] {
        jobs.update_cell(&"build", 2, Value::Int(done));
        // Only the `build` row is laid out again; the rest come from the cache.
        live.update(region.clone(), target.segments(&jobs))?;
        live.refresh()?;
    }
    jobs.update_cell(&"build", 1, "done");
    live.update(region, target.segments(&jobs))?;
    live.finish()?;

    let stats = jobs.stats();
    eprintln!(
        "{} frames, {} row renders, {} relayouts",
        stats.frames, stats.rows_rendered, stats.relayouts
    );
    Ok(())
}
use std::io::IsTerminal;

let interactive = std::io::stdout().is_terminal();
let capabilities = TargetCapabilities {
    width: 60,
    height: 12,
    color_system: Some(ColorSystem::Standard),
    interactive,
    unicode: true,
    hyperlinks: false,
    sixel: Support::Unsupported,
};
let kind = if interactive {
    TargetKind::Terminal
} else {
    TargetKind::PlainStream
};
let target = RenderTarget::new(kind, capabilities, Theme::default_theme());
run_live(target).expect("live output");
What a frame renders again
Each row caches three things: its formatted cells, their widths and its rendered lines. Rendering a frame works like this:
- Only rows written since the last frame are formatted again.
- If no column's width changed, only those rows are laid out again. The rest are copied from the cache.
- If a column's width did change, every visible row is laid out again. That happens when a new row widens a column, when the widest row is removed, or when the available width changes.
- Writing a value equal to the current one is not a change.
Value::Textcells are the exception: they always count as changed, because their base style cannot be compared. - Sorting only reorders cached rows. A change to the window only drops or adds rows.
stats() returns counters for this (frames, rows_prepared,
rows_rendered, relayouts), so tests can assert what a frame re-rendered.
The streamed output is byte for byte what to_table() (a core Table of the
same rows, built from scratch) renders, apart from the window's indicator
line. The test suite checks that equality after every step of a mixed
workload.
How this stays exact: the core sizes a column from the widest cell in it and nothing else. Each changed row is rendered by a core table that holds the row plus one extra row made of each column's widest cell. So the row gets exactly the widths the full table would give it.
Gotchas:
- Cached lines keep the styles they were rendered with. If you render the
same table on consoles with different themes, call
invalidate()between them. - Row separators (
show_lines) are not supported. A frame can have a title, a caption, a box style, andshow_edge,expandandborder_style. to_data()takes a snapshot of the rows in display order as aTableData, for grouping and aggregates.
Styles
| Key | Default | Used for |
|---|---|---|
table.group |
bold |
Group header rows |
table.aggregate |
italic |
Summary and totals rows |
table.sort_indicator |
cyan |
▲/▼ in headers |
table.more |
dim |
The window's … N more rows line |
These keys are listed in table::STYLES and included in extended_theme().
If a theme lacks a key, the renderers fall back to the default in this table.
The names don't clash with upstream's table.header, table.footer,
table.cell, table.title and table.caption. Everything reads the same
without colour.
Accessibility
TableData and StreamingTable implement a11y::AccessibleText through
their core Table. The result is the same Table with N rows, columns: …
summary that a core table produces.